
The Support and Resistance MTF indicator for MT4 displays support and resistance levels from multiple timeframes directly on a single price chart.
This allows you to see where important levels from M1, M5, M15, M30, H1, H4, D1, W1 and MN1 are located without switching between charts.
Multi-timeframe levels can provide stronger technical context than a level identified from one timeframe alone.
For example, an H1 resistance level that closely matches an H4 resistance zone can become an important area to watch for either a breakout or rejection.
The tool can therefore help with entry timing, stop placement and profit targets across different trading approaches.
Why traders use the Support and Resistance MTF Indicator
Support and resistance are central to many Forex strategies, but monitoring several timeframes manually can be time-consuming.
This tool brings those levels together so you can quickly identify areas where price may react.
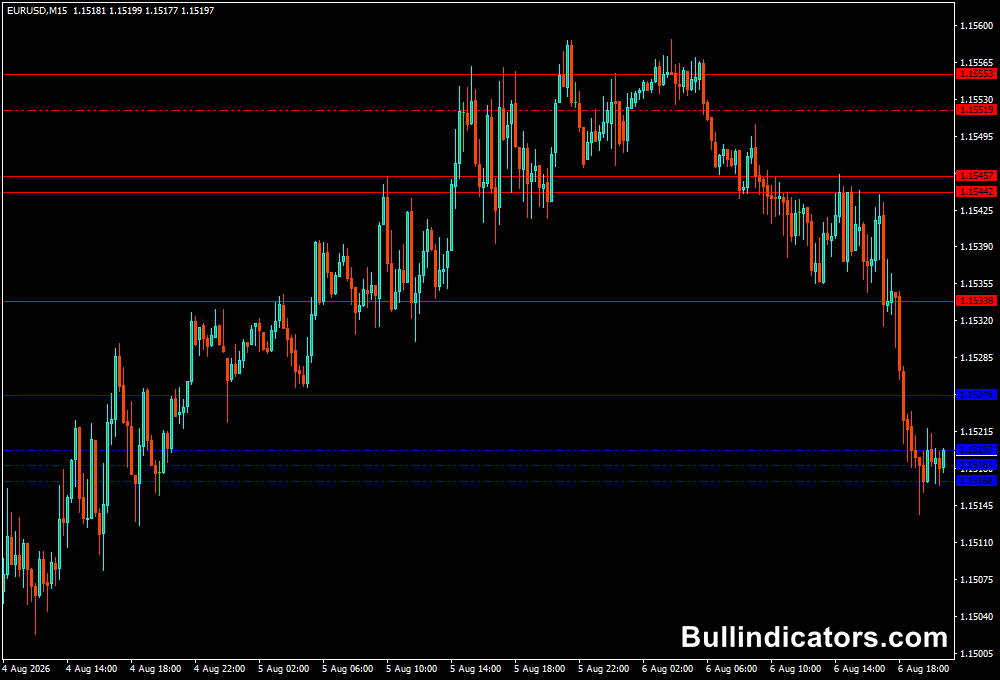
Blue lines represent support while red dotted lines represent resistance.
When several timeframe levels cluster around a similar price, that area deserves particular attention.
A trader can then wait for price action to determine whether the level will hold or break.
The indicator is useful for both reversal and breakout strategies.
A failed test of resistance can provide a potential short setup, while a confirmed break above resistance can signal a continuation move.
The same principle applies to support.
Download This MT4 Indicator for Free
Indicator Chart Setup
The Support and Resistance MTF Indicator places horizontal levels on the MT4 price chart.
Blue lines identify support areas and red dotted lines identify resistance.
You can choose which timeframes contribute levels to the current chart.
For scalping, displaying M1, M5, M15 and H1 levels can provide a useful combination of short-term and higher-timeframe reference points.
For swing trading, H4, D1 and W1 levels may carry more importance.
Core Features
- Displays support and resistance from multiple timeframes.
- Blue lines represent support levels.
- Red dotted lines represent resistance levels.
- Supports timeframes from M1 through MN1.
- Helps identify breakout and reversal zones.
- Useful for stop-loss and take-profit planning.
- Can be adapted to scalping, intraday and swing strategies.
Best for
- Multi-timeframe support and resistance analysis.
- Breakout trading around important price levels.
- Reversal setups at established support and resistance.
- Scalping on M1 and M5 charts.
- Planning entry, stop and profit zones.
Best Markets
- EUR/USD for short-term scalping around well-defined levels.
- GBP/USD when London-session volatility creates breakout opportunities.
- USD/JPY for intraday support and resistance reactions.
- GBP/JPY for fast-moving M1 and M5 setups.
- Gold (XAU/USD) when strong volatility creates clear reaction zones.
Trading Styles
- M1 and M5 scalping.
- Intraday breakout trading.
- Support and resistance reversals.
- Momentum trading after confirmed level breaks.
- Multi-timeframe price-action trading.
How traders use it
The most effective approach is to combine the multi-timeframe levels with price action.
A level should be treated as an area where a reaction may occur rather than an automatic buy or sell signal.
M1 and M5 Scalping with the No Repaint Scalper Indicator
For short-term trading, the Support and Resistance MTF Indicator can be combined with the No Repaint Scalper Indicator for MT4.
The support and resistance levels identify important price areas, while the arrows provide the entry trigger.
Guidelines
- Use the M1 or M5 chart for the scalp setup.
- Keep relevant higher-timeframe levels visible, particularly M15 and H1.
- For a buy setup, watch for price to approach or react from a blue support level.
- Wait for a blue arrow from the No Repaint Scalper Indicator.
- Use the blue arrow as confirmation for a potential long entry.
- For a sell setup, watch for price to approach or reject a red resistance level.
- Wait for a red arrow from the No Repaint Scalper Indicator.
- Use the red arrow as confirmation for a potential short entry.
- Consider a 5-10 pip profit target when volatility and spread conditions are suitable.
- Place the stop beyond the relevant support or resistance area, or according to your predefined risk.
Example: M5 Buy Setup
- EUR/USD approaches a blue support level visible on the M5 chart.
- Price tests the area but fails to break decisively below it.
- A blue arrow appears below the price candles.
- The blue arrow provides the potential buy trigger.
- A scalp can target approximately 5-10 pips toward the next resistance level.
- If price breaks the support decisively, avoid the long setup and reassess the market.
Example: M1 Sell Setup
- GBP/JPY approaches a red resistance level visible on the M1 chart.
- Price rejects the resistance area.
- A red arrow appears above the candles.
- The red arrow provides the potential sell trigger.
- A 5-10 pip target can be considered when downside momentum is sufficient.
- The trade can be protected above the resistance zone or the latest M1 swing high.
With suitable market conditions, this type of setup can provide several scalping opportunities throughout the day.
London and New York sessions often offer more movement, although the spread and volatility should always be considered before targeting only a few pips.
Get Instant Free Access
Indicator Settings
- maxBarsForPeriod: Determines the number of historical bars used for the analysis.
- ShowM01: Enables M1 support and resistance levels.
- ShowM05: Enables M5 levels.
- ShowM15: Enables M15 levels.
- ShowM30: Enables M30 levels.
- ShowH01: Enables H1 levels.
- ShowH04: Enables H4 levels.
- ShowD01: Enables daily levels.
- ShowW01: Enables weekly levels.
- ShowMN1: Enables monthly support and resistance levels.
Important Notes
- A support or resistance level does not guarantee a reversal.
- Use the higher-timeframe levels to provide context for M1 and M5 trades.
- For scalping, avoid entering immediately when price reaches a level; wait for price action and the arrow confirmation.
- Keep profit targets realistic when trading for 5-10 pips because spreads and execution costs have a greater impact on small targets.
- Multiple levels clustering around the same price can create a more significant technical area.
- Test the combination on your preferred currency pairs and trading sessions before using it with live capital.









