
The Woodies Arrows Oscillator indicator for MT4 is a momentum-based tool built around the Commodity Channel Index and designed for traders who use Woodies CCI concepts.
It combines CCI calculations with additional trend and smoothing components while displaying directional arrows that can help identify potential entry points.
Green arrows represent bullish signals and red arrows indicate bearish conditions.
Beyond the arrows, the oscillator can be used to study the CCI, Turbo CCI, zero line, histogram, and key 200 levels.
This makes it suitable for both straightforward signal-based trading and more detailed momentum analysis.
Why traders use the Woodies Arrows Oscillator
The Woodies approach can involve several elements, including CCI movement, momentum shifts, trend direction, and reactions around important levels.
The arrows make the system easier to follow by highlighting potential directional changes directly on the chart.
The oscillator is particularly useful when the arrow signal agrees with the broader trend.
For example, a green arrow that appears while price is already producing higher highs and higher lows can support a continuation trade.
A red signal within a declining market can similarly provide a potential short-term entry.
More experienced traders can go beyond the arrows and analyze the relationship between the CCI and its supporting calculations.
This allows the tool to fit a range of Woodies-based strategies rather than restricting its use to a single entry method.
Download This MT4 Indicator for Free
Indicator Chart Setup
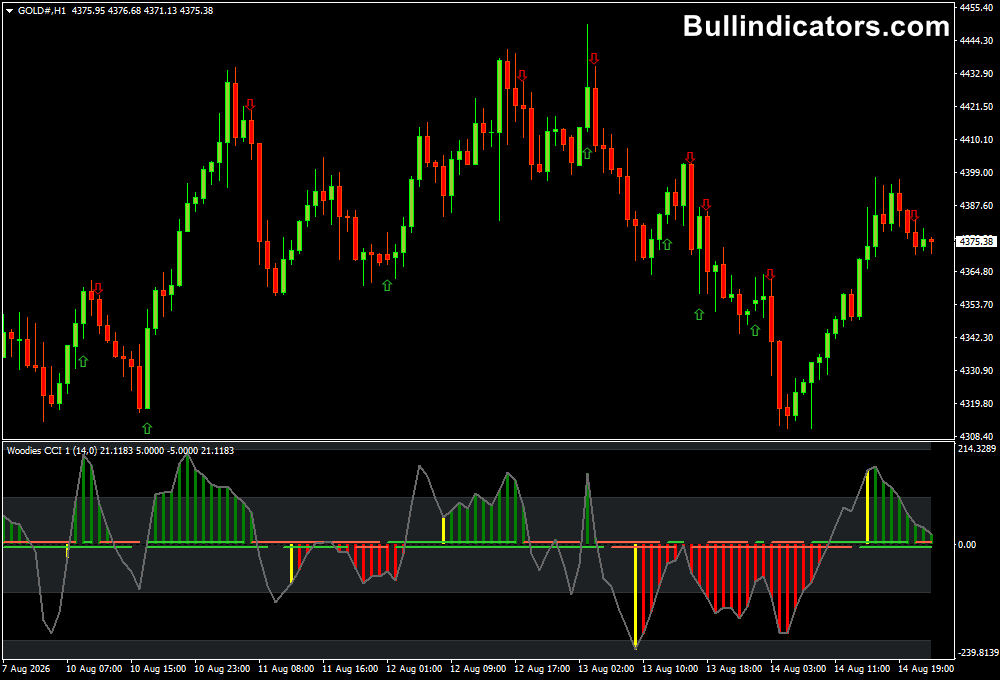
The oscillator appears in a separate MT4 window, while its directional arrows are displayed on the main price chart.
Green arrows identify potential bullish entries and red arrows highlight potential bearish opportunities.
The oscillator also provides access to CCI-based momentum information, including the zero line, histogram, and selected levels.
Depending on the settings, LSMA and EMA calculations can also be displayed for additional trend context.
Core Features
- Based on the Commodity Channel Index.
- Provides green bullish and red bearish arrows.
- Includes Turbo CCI and trend calculations.
- Supports LSMA and EMA components.
- Can display important CCI zones and levels.
- Suitable for Woodies-style momentum and trend analysis.
- Includes configurable arrow and alert settings.
Best for
- CCI momentum analysis.
- Trading Woodies-style setups.
- Identifying directional changes with arrow signals.
- Confirming trend continuation after pullbacks.
- Combining momentum signals with price structure.
Best Markets
- EURUSD for structured intraday momentum on M15 and H1.
- GBPUSD during active London and New York trading periods.
- USDJPY for directional setups around key session levels.
- GBPJPY when stronger momentum produces larger price swings.
- NAS100 for traders focusing on fast momentum changes during the US session.
Trading Styles
- Scalping on M5 and M15 with trend confirmation.
- Intraday momentum trading on M15 and H1.
- Trend-following setups using the arrows and CCI direction.
- Woodies CCI pattern trading.
- Pullback entries when momentum resumes in the dominant direction.
How traders use it
The simplest method is to use the arrows as directional triggers and then check whether price structure supports the signal.
Always trade in the direction of the main trend whenever possible.
The oscillator should provide timing while the broader market structure determines whether the trade makes sense.
Buy Setup
- Identify a bullish market structure with higher highs and higher lows.
- Wait for the oscillator to support bullish momentum.
- Look for a green upward arrow on the price chart.
- Check whether the signal develops after a pullback or near a supportive price area.
- Confirm that the CCI is supporting the bullish direction.
- Enter a buy after the signal and price action agree.
- Place the stop loss below the recent swing low.
- Target the previous high, resistance, or a predefined risk-to-reward level.
Sell Setup
- Establish that the broader market is bearish.
- Wait for bearish momentum to develop in the oscillator.
- Look for a red downward arrow.
- Prefer signals that appear following a bearish pullback toward resistance.
- Confirm that CCI movement supports the downside.
- Enter a sell after confirmation.
- Place the stop loss above the recent swing high.
- Target the previous low, support, or a predefined profit objective.
Zero-Line Confirmation
The CCI zero line can provide an additional momentum filter.
A move above zero can support bullish conditions, while a move below zero can confirm increasing bearish pressure.
For example, a green arrow combined with CCI strength above zero can offer stronger trend-following confirmation than an isolated arrow.
Trend Continuation Strategy
During a strong trend, traders can remain in a position while the directional signals continue to support the existing move.
A trader holding a long position can monitor for an eventual red arrow or clear deterioration in momentum as an exit warning. The same principle applies in reverse for short positions.
Get Instant Free Access
Indicator Settings
- CCIPeriod: Sets the period used to calculate the main CCI.
- TrendPeriod: Determines the period used for the trend calculation.
- TurboCCIPeriod: Sets the calculation period for the Turbo CCI component.
- LSMAPeriod: Controls the period used for the Least Squares Moving Average.
- LSMAPrice: Selects the price data used for the LSMA calculation.
- EMAPeriod: Determines the EMA calculation period.
- EMAPrice: Selects the price source used by the EMA.
- ShowLsmaEma: Enables or disables the LSMA and EMA display.
- EMAVisible: Controls whether the EMA is visible.
- LSMAVisible: Controls whether the LSMA is displayed.
- ShowZones: Enables or disables the displayed CCI zones.
- ZonesColor: Sets the color used for the zones.
- LinesColor: Controls the color of the oscillator lines.
- Arrow Settings: Controls the appearance and behavior of the directional arrows.
- Alerts: Enables or disables notifications for new signals.
Important Notes
- Always trade in the direction of the main trend whenever possible.
- A green arrow represents a potential bullish signal, while a red arrow indicates a potential bearish signal.
- Do not treat every arrow as an automatic entry without checking market structure.
- CCI signals can remain extreme during strong trends, so an overextended reading does not automatically indicate a reversal.
- Zero-line movement and price structure can provide useful confirmation for arrow signals.
- Lower timeframes generally produce more signals and more market noise.
- Use appropriate stop-loss placement and consistent risk management for every position.









