
The FXSSI Sentiment indicator for MT4 provides a simple view of the balance between open BUY and SELL positions in the market.
Rather than measuring price momentum directly, it shows how market participants are positioned, giving traders another layer of information when evaluating a potential setup.
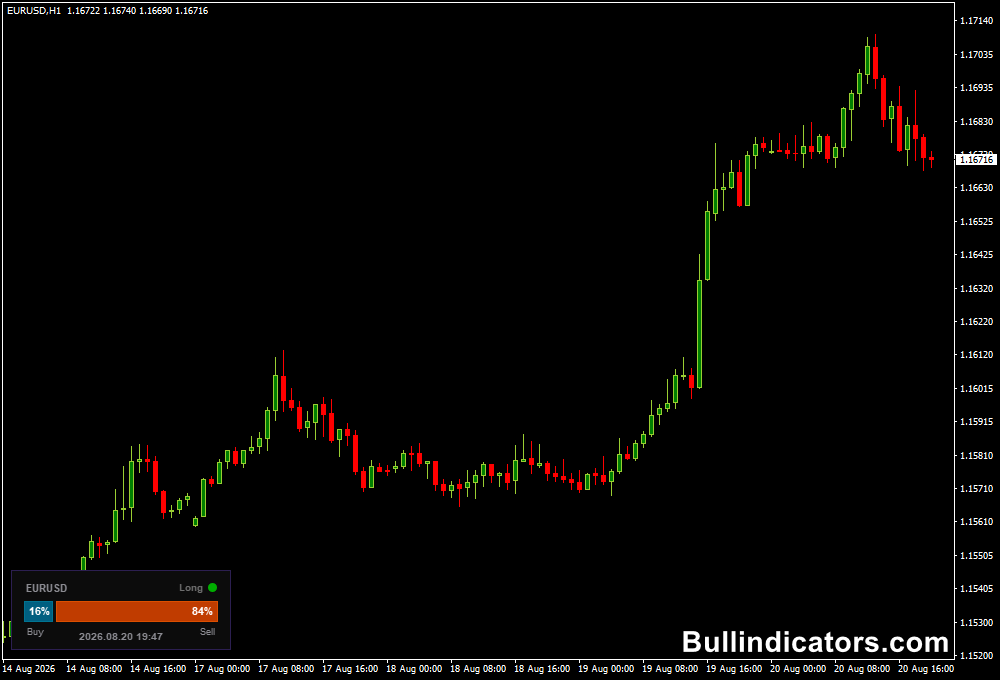
The indicator displays the current buyer-to-seller ratio as a colored scale.
Blue represents BUY positions, while red represents SELL positions.
This sentiment information can be particularly useful when combined with price action, support and resistance, or a separate entry indicator.
Why traders use the FXSSI Sentiment Indicator
Price alone does not reveal how market participants are positioned.
A currency pair can be moving lower while a large percentage of open positions remain long, or price can rise while short positions dominate.
The sentiment reading provides this additional perspective.
The indicator is especially useful as a confirmation tool.
For example, if price is approaching support while the market is heavily positioned on the SELL side, a trader may watch for signs that the correction is losing momentum.
Likewise, an excessive BUY ratio near resistance can provide useful context before considering a short setup.
It can be used for intraday trading, swing analysis and scalping.
For very short-term strategies, updating the sentiment data more frequently can make the reading more relevant to current market conditions.
Download This MT4 Indicator for Free
Indicator Chart Setup
The FXSSI Sentiment indicator displays a compact scale on the MT4 chart showing the percentage of BUY and SELL positions.
The blue section represents buyers and the red section represents sellers.
A larger blue section means long positions dominate the displayed data, while a larger red section indicates greater short positioning.
The data can update automatically at a selected interval, and a manual refresh is also available.
Depending on the trading style, the update frequency can be adjusted so that the sentiment reading remains relevant to the timeframe being traded.
Core Features
- Displays the percentage of BUY and SELL positions.
- Uses a simple blue and red sentiment scale.
- Can automatically update market positioning data.
- Supports manual data refreshing.
- Allows a specific currency pair to be selected.
- Can be used for scalping, intraday and medium-term analysis.
- Works as a confirmation tool alongside other trading methods.
Best for
- Measuring the balance between long and short positions.
- Confirming setups around support and resistance.
- Identifying potentially crowded market positioning.
- Adding sentiment confirmation to an existing strategy.
- Short-term scalping when the data is updated frequently.
Best Markets
- EURUSD for highly liquid short-term sentiment analysis.
- GBPUSD and GBPJPY when strong intraday movements develop.
- USDJPY around major support and resistance levels.
- AUDUSD and USDCAD for trend and correction setups.
- Other major currency pairs where reliable sentiment data is available.
Trading Styles
- Scalping on M1 and M5 charts.
- Intraday trading on M15 and H1.
- Correction and trend-resumption strategies.
- Support and resistance trading.
- Multi-factor technical analysis.
How traders use it
The sentiment reading works best as part of a broader trading system because it does not independently determine whether price will rise or fall.
A common approach is to identify the technical setup first and then use positioning data as additional confirmation.
Scalping EURUSD M5 strategy with the Sentiment indicator
For example, the No Repaint Alerts Scalper Indicator for MT4 can be combined with FXSSI Sentiment for short-term trading.
On an M5 chart, the green arrow represents a BUY signal and the red arrow represents a SELL signal.
A trader can then use the sentiment ratio as a filter before entering.
For a scalping approach targeting approximately 7–10 pips, consider EURUSD M5.
If the No Repaint Alerts Scalper produces a green BUY arrow near support and the FXSSI reading shows a strong percentage of SELL positions, the setup can be interpreted as a potential correction that is losing downside pressure.
A BUY entry can be considered after the price action confirms the move.
For a SELL setup, a red arrow near resistance combined with a high percentage of BUY positions can provide the opposite context.
The position can target around 7–10 pips when market volatility and nearby price levels provide sufficient room.
Buy Rules
- Use the M5 chart and identify a relevant support area.
- Wait for the No Repaint Alerts Scalper to produce a green BUY arrow.
- Check that the FXSSI sentiment shows a meaningful concentration of SELL positions.
- Confirm that price is reacting positively from support.
- Enter BUY once the short-term bullish reaction is established.
- Target approximately 7–10 pips when the next resistance level allows enough room.
- Place the stop below the support or recent M5 swing low.
Sell Rules
- Use the M5 chart and locate a relevant resistance area.
- Wait for the No Repaint Alerts Scalper to produce a red SELL arrow.
- Check that the FXSSI sentiment shows a high percentage of BUY positions.
- Look for bearish rejection from resistance.
- Enter SELL after downside momentum is confirmed.
- Target approximately 7–10 pips where the next support level permits.
- Place the stop above the resistance or recent M5 swing high.
Get Instant Free Access
Indicator Settings
- Defined Symbol: Allows a specific currency pair to be entered manually, such as GBPUSD or EURUSD.
- Signal Ratio: Defines the positioning thresholds used for the BUY and SELL indications. For example, 40% and below can represent a BUY condition, while 60% and above can represent a SELL condition.
- Server Time Offset: Adjusts the indicator to the required time zone.
- Color Scheme: Selects the visual color scheme.
- Indicator Position: Controls where the sentiment display appears on the MT4 chart.
Important Notes
- Sentiment data should not be interpreted as a standalone BUY or SELL system.
- A high percentage of buyers does not automatically mean price will fall, nor does heavy selling automatically guarantee a rise.
- For scalping, frequent data updates can make the sentiment reading more relevant to current market conditions.
- Support, resistance and price action remain important when evaluating the sentiment reading.
- The positioning data reflects the sources used by the indicator and may not represent every participant in the global Forex market.
- For short-term targets such as 7–10 pips, avoid entries when major support or resistance is too close to the intended target.









