The Fair Value Gaps indicator for MT4 is a price action tool that highlights bullish and bearish imbalance zones directly on the chart.
It scans for strong candles that leave a gap between surrounding price action and then marks those areas with horizontal rectangles.
This gives traders a quick way to spot zones where price may react, retrace, or continue after an impulsive move.
Chart Setup
The chart setup below shows how the Fair Value Gaps indicator marks bullish and bearish imbalance zones directly on the main price area.
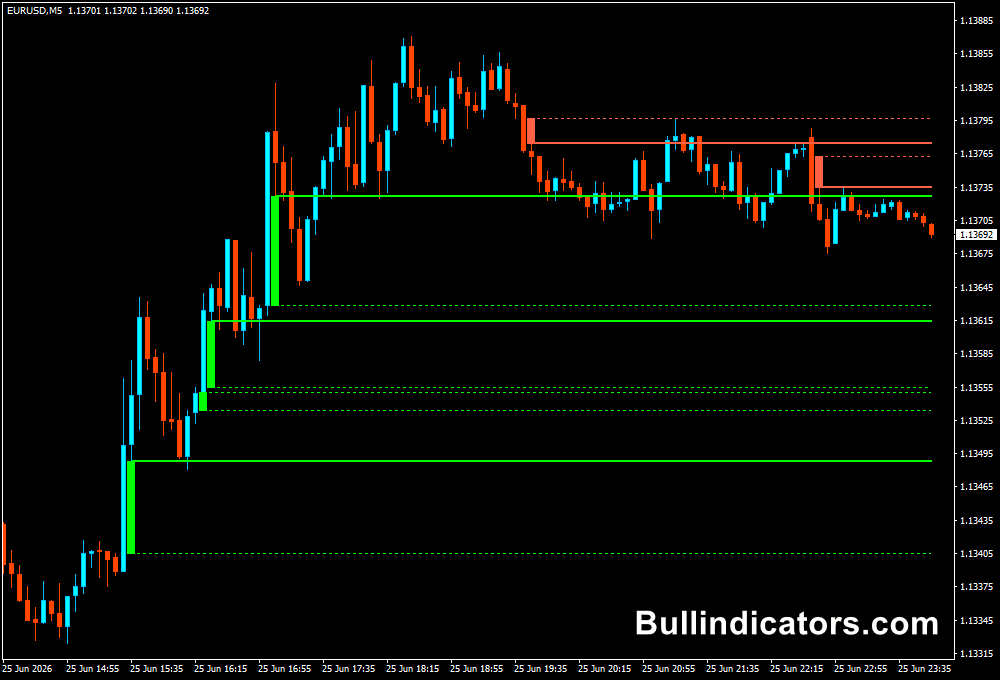
These rectangles and colored lines help traders spot unfilled gaps left behind by strong price moves and make it easier to track potential retracement zones without drawing them manually.
What the indicator shows
- Bullish and bearish fair value gaps plotted directly on the main price chart
- Horizontal FVG rectangles that mark open imbalance zones
- Areas where price moved aggressively and left part of the move unfilled
- A visual map of potential pullback or reaction zones without manual chart marking
Best for
- Traders who use price action and market structure
- Intraday traders looking for pullback entries after strong moves
- Traders who want fair value gaps marked automatically
- Beginners who want imbalance zones displayed clearly on the chart
Works well on
- M5 to H1 for intraday trading setups
- M15 and H1 when you want cleaner and more selective fair value gap zones
- Lower timeframes for scalping when combined with a clear directional bias
Trading style
- Scalping
- Intraday trading
- Pullback trading
- Trend continuation setups
How traders use it
- Wait for price to return into a fresh bullish or bearish fair value gap
- Use bullish FVG zones as potential pullback areas in an uptrend
- Use bearish FVG zones as possible retracement areas in a downtrend
- Combine the zone with support and resistance, market structure, or a trend filter for confirmation
- Focus on fresh imbalance zones created by strong candles instead of old gaps left behind in sideways conditions
- Use the indicator as a zone-mapping tool rather than a direct buy or sell signal system
Key inputs
- Display_FVG_Option – show bullish fair value gaps, bearish fair value gaps, or both
- Minimum_FVG_Size_In_Points – filters out smaller gaps and keeps only imbalances above a chosen size
- Bullish FVG Zone Color / Bearish FVG Zone Color – changes the appearance of the plotted zones
- Fvg area length – controls how far the FVG zone extends to the right on the chart
- Look-back candle count – defines how many candles the indicator scans for fair value gaps
- Show lookback line / Look-back line color – adds a visual guide for the scan range
- Alert PopUp / Alert Email / Alert Push Notification – enables notifications when a new fair value gap appears
- Alert delay candle count – adjusts how quickly alerts are triggered
Keep in mind
- The indicator marks imbalance zones, not direct buy or sell signals
- Fresh fair value gaps are usually more relevant than older zones left behind in choppy markets
- Best results often come when an FVG lines up with the broader trend or a clear structure level
This is a solid indicator for identifying support and resistance in both uptrends and downtrends. One tip that works well for me: in an uptrend, wait for a pullback to one of the green lines and look for a bounce; in a downtrend, do the opposite.