
The My Price Action Indicator for MT4 is a candlestick analysis tool designed to help traders identify important price action formations automatically.
Instead of manually searching every candle for rejection patterns, the indicator highlights candles with significant upper or lower shadows that may indicate increased buying or selling pressure.
The indicator focuses on the relationship between candle bodies and wicks, helping traders recognize potential reversal areas and market reactions.
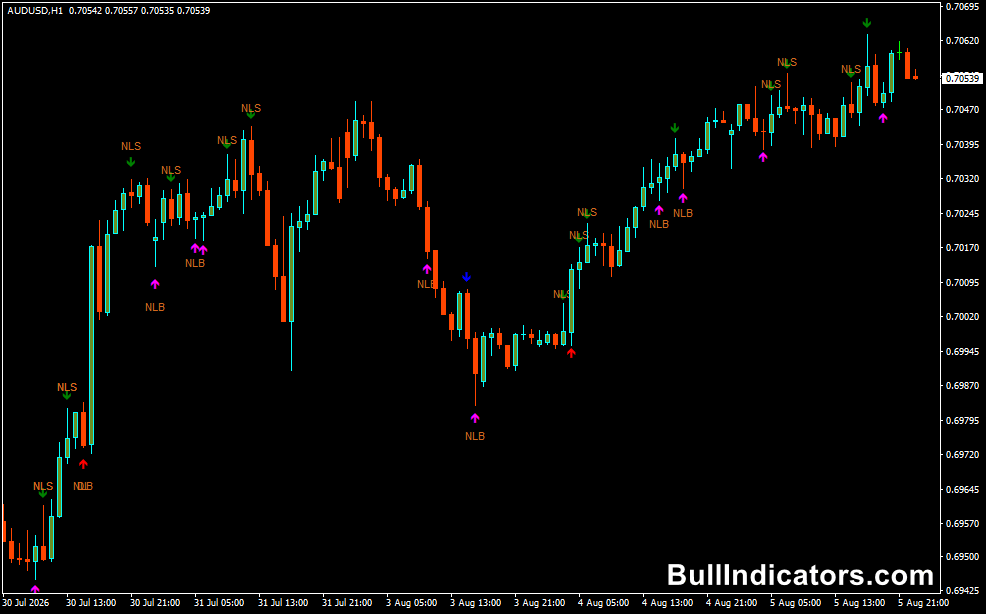
Colored arrows appear above or below candles to highlight possible price action signals, while additional labels provide more information about the detected formation.
Although the signals can be useful, the indicator works best when combined with market structure, support and resistance levels, and other confirmation methods.
Why traders use the My Price Action Indicator
Reading candlestick patterns manually requires experience and constant chart monitoring.
The My Price Action Indicator simplifies this process by automatically identifying candles with characteristics often associated with market reversals or strong rejection.
Long lower wicks may suggest that buyers are defending a price area, while long upper wicks can indicate selling pressure.
By highlighting these moments, the indicator helps traders quickly locate areas where price may react.
Many price action traders use this tool as a scanning assistant, allowing them to focus on the most relevant candles rather than analyzing every market movement. T
he signals can be combined with trend direction, support and resistance zones, or higher timeframe analysis to improve accuracy.
Download This MT4 Indicator for Free
Indicator Chart Setup
The indicator places colored arrows directly on the price chart when a potential price action pattern is detected.
Arrows below candles highlight possible bullish pressure, while arrows above candles indicate potential bearish pressure.
The indicator can also display additional candle information, including daily highs and BEOV patterns similar to pin bars.
Core Features
- Automatically detects important candlestick formations.
- Identifies bullish and bearish rejection candles.
- Uses candle wick analysis to measure market pressure.
- Displays colored arrows directly on the chart.
- Highlights potential reversal zones.
- Includes optional daily high display.
- Detects BEOV patterns similar to pin bars.
Best for
- Price action trading.
- Candlestick pattern analysis.
- Finding reversal areas.
- Support and resistance trading.
- Confirmation of manual chart analysis.
Best Markets
- EUR/USD for clean technical price action.
- GBP/USD during London session volatility.
- USD/JPY for trend continuation setups.
- Gold (XAU/USD) around major support and resistance levels.
- GBP/JPY for strong rejection moves.
- Major Forex pairs with good liquidity.
Trading Styles
- Price action trading.
- Reversal trading.
- Swing trading.
- Intraday trading.
- Trend pullback trading.
- Multi-timeframe analysis.
How traders use it
The main idea behind the indicator is identifying rejection candles.
When price moves into an important area and leaves a long wick, it can show that buyers or sellers have rejected that price level.
For example, a long lower wick appearing near support suggests buyers entered the market and pushed price higher.
Traders may look for a buy opportunity after additional confirmation. A long upper wick near resistance may indicate that sellers are becoming active and a bearish move could develop.
The indicator should not be used as an automatic buy or sell system.
The strongest setups usually occur when the price action signal appears at a meaningful market level.
Example Strategy Using the H4 Chart
This simple strategy uses the indicator to find rejection setups on higher timeframes.
- Open a EUR/USD or GBP/USD H4 chart.
- Identify a consolidation zone or important support/resistance level.
- Wait for a pink arrow below a candle with the NLB label.
- Confirm that the candle has a strong lower wick showing buyer rejection.
- Enter a buy trade after the candle closes.
- Place the stop-loss below the candle shadow.
- Exit when an opposite signal appears or when price reaches a strong resistance area.
For sell trades, wait for a green arrow above the candle with the NLS label near resistance. Enter after confirmation and place the stop-loss above the rejection wick.
Get Instant Free Access
Indicator Settings
- Twick_ratio – Defines the ratio between candle high and low calculations.
- Hightwick1 – Sets the first upper wick height in pips.
- Hightwick2 – Sets the second upper wick height in pips.
- Lowtwick1 – Sets the first lower wick height in pips.
- Lowtwick2 – Sets the second lower wick height in pips.
- ShowDH – Enable to display daily high levels on candles.
- Show BEOV – Enable to display BEOV patterns similar to pin bars.
Important Notes
- The indicator identifies potential price action patterns but does not guarantee market direction.
- Use confirmation from support, resistance, or trend analysis.
- Higher timeframe signals generally provide stronger setups.
- Avoid trading isolated signals without considering market context.
- Combine the indicator with proper risk management.
- Backtest the settings before using them on a live account.
- Practice on a demo account before risking real capital.









