
The Cumulative Delta Indicator for MT4 helps measure the balance between buying and selling pressure by calculating the cumulative difference between buyers and sellers.
Rather than focusing only on price movement, this tool provides insight into the underlying market momentum, allowing traders to determine which side currently controls the market.
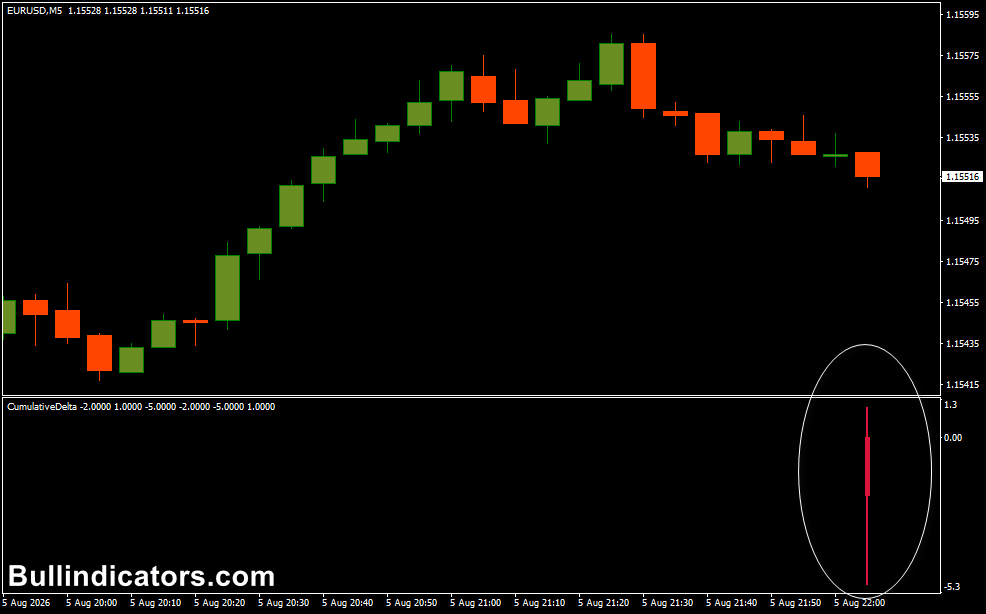
The indicator displays colored histogram bars in a separate window below the chart.
Green bars indicate increasing buying pressure, while red bars show that sellers are dominating.
Larger histogram bars generally represent stronger momentum and can help confirm whether a breakout or trend is supported by genuine market participation.
Because the indicator is simple to interpret, it is suitable for both beginners and experienced traders looking for additional confirmation before entering a position.
Why traders use the Cumulative Delta Indicator
Price alone does not always reveal the strength behind a market move.
The Cumulative Delta Indicator provides an extra layer of information by showing whether buyers or sellers are becoming increasingly aggressive.
This makes it easier to distinguish between strong trends and weak price movements that may quickly reverse.
Many traders use the indicator as a trend confirmation tool rather than relying on it as a standalone signal generator.
Strong green bars often confirm bullish momentum, while expanding red bars support bearish trends.
Combined with support and resistance levels or price action, the indicator can significantly improve trade selection.
The indicator performs well across all timeframes, including M15, H1, H4, and Daily charts, and can be applied to Forex pairs, commodities, indices, and CFDs.
Download This MT4 Indicator for Free
Indicator Chart Setup
The indicator appears below the main chart as a histogram.
Green bars represent stronger buying pressure, while red bars indicate stronger selling pressure.
The larger the histogram bar becomes, the greater the imbalance between buyers and sellers.
Consecutive bars of the same color often confirm that momentum continues in the current market direction.
Core Features
- Displays cumulative buying and selling pressure.
- Simple green and red histogram.
- Helps confirm trend strength.
- Highlights momentum shifts.
- Supports all MT4 timeframes.
- Useful for breakout confirmation.
- Works across Forex, indices, commodities, and CFDs.
Best for
- Trend confirmation.
- Momentum analysis.
- Breakout validation.
- Volume-based trading.
- Filtering weak market signals.
Best Markets
- GBP/JPY during the London session.
- EUR/JPY during active European trading hours.
- EUR/USD and GBP/USD during London and New York overlap.
- Gold (XAU/USD) during periods of high volatility.
- Generally, major Forex pairs with strong liquidity and low spreads.
Trading Styles
- Scalping.
- Intraday trading.
- Momentum trading.
- Breakout trading.
- Trend following.
- Multi-timeframe analysis.
How traders use it
Many traders first identify the market direction using higher timeframe analysis before using the Cumulative Delta Indicator to confirm entries.
A series of growing green histogram bars during an uptrend suggests buyers remain in control, while expanding red bars during a downtrend indicate continued selling pressure.
The indicator is particularly useful for avoiding weak breakouts.
If price breaks above resistance but the histogram fails to strengthen, the breakout may lack conviction.
On the other hand, when both price and cumulative delta increase together, the probability of continuation generally improves.
London Session Range Breakout Strategy (GBP/JPY & EUR/JPY)
This strategy is designed for the highly active London session using the M15 timeframe.
- Draw the Asian session high and low before the London market opens.
- Wait for GBP/JPY or EUR/JPY to break above or below the Asian range.
- Confirm the breakout with a large green histogram for buy trades or a large red histogram for sell trades.
- Only enter after the breakout candle closes outside the range.
- Place the stop-loss on the opposite side of the breakout range.
- Target at least twice the initial risk or trail the stop as momentum continues.
- If price breaks the range but the histogram remains weak or changes color quickly, avoid the trade as the breakout may fail.
This method works particularly well because GBP/JPY and EUR/JPY often experience sharp increases in volatility during the London session.
The Cumulative Delta Indicator helps confirm whether institutional buying or selling pressure supports the breakout.
Get Instant Free Access
Indicator Settings
- Show Cumulative – Displays cumulative delta values over the selected timeframe.
- Record Ticks – Enables or disables saving tick history.
- Print History – Builds historical calculations from stored tick data. When disabled, calculations begin from zero.
Important Notes
- The indicator measures buying and selling pressure rather than predicting future prices.
- Use cumulative delta together with price action for stronger confirmation.
- Higher momentum bars generally indicate stronger market conviction.
- Avoid trading low-volume market sessions where momentum is limited.
- Always apply proper stop-loss and position sizing.
- The indicator performs best on liquid instruments with consistent trading activity.
- Practice new strategies on a demo account before trading with real capital.









