
The MACD Divergence indicator for MT4 is an advanced momentum analysis tool designed to identify differences between price movement and MACD behavior.
These divergences often appear before important market changes, helping traders detect possible trend reversals or continuation opportunities before they become obvious on the chart.
The indicator combines the MACD histogram with moving average calculations to highlight changes in momentum.
It automatically identifies both regular and hidden divergence patterns and displays them directly on the chart using trendlines, making it easier to recognize potential trading opportunities.
While divergence analysis is popular among swing traders, scalpers can also benefit from this tool by using it with shorter timeframes and a strong trend filter.
Why traders use the MACD Divergence Indicator
Divergence occurs when price and momentum move in opposite directions.
For example, price may create a lower low while the MACD forms a higher low, showing that selling pressure is weakening.
This can warn traders that a potential bullish reversal may develop.
The indicator helps remove much of the manual work involved in finding these patterns by automatically comparing price action with MACD momentum.
It identifies:
- Regular bullish divergence for possible trend reversals.
- Regular bearish divergence for possible bearish reversals.
- Hidden bullish divergence for trend continuation.
- Hidden bearish divergence for trend continuation.
Many experienced traders use divergence as a confirmation tool together with moving averages, support and resistance, and candlestick patterns to improve trade timing.
Download This MT4 Indicator for Free
Indicator Chart Setup
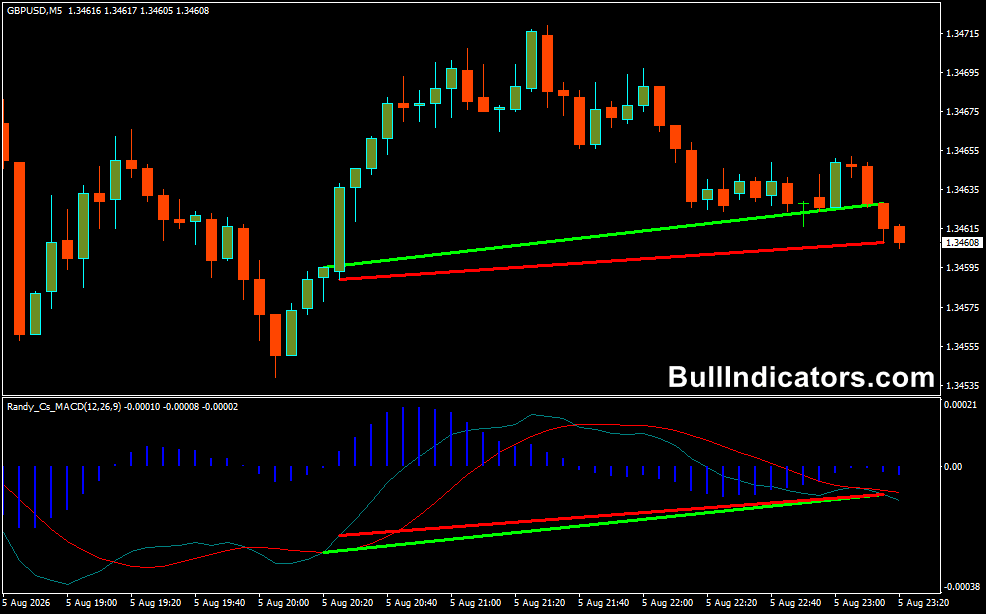
The indicator displays the MACD histogram in a separate window while marking detected divergence patterns with colored trendlines.
The MACD calculation includes the fast EMA, slow EMA, and signal moving average.
Divergence lines connect important highs and lows on both price and the MACD window, showing where momentum is weakening or strengthening.
Core Features
- Automatically detects MACD divergences.
- Identifies regular and hidden divergence patterns.
- Displays MACD histogram momentum.
- Includes fast and slow EMA calculations.
- Highlights possible reversal areas.
- Helps identify trend continuation setups.
- Suitable for multiple trading strategies.
Best for
- Finding early reversal signals.
- Confirming trend continuation.
- Momentum analysis.
- Price action confirmation.
- Multi-timeframe trading.
Best Markets
- EUR/USD for technical intraday setups.
- GBP/USD during London volatility.
- USD/JPY for trend continuation trades.
- GBP/JPY for strong momentum movements.
- Gold (XAU/USD) around major market levels.
- Major currency pairs with strong liquidity.
Trading Styles
- Scalping.
- Intraday trading.
- Swing trading.
- Trend following.
- Momentum trading.
- Reversal trading.
How traders use it
A regular divergence setup is often used to anticipate a possible reversal.
A bullish regular divergence appears when price creates lower lows while MACD creates higher lows.
This suggests sellers are losing strength and buyers may regain control.
A bearish regular divergence develops when price reaches higher highs while MACD forms lower highs.
This indicates weakening buying pressure and a possible downside move.
Hidden divergence is used differently.
It often confirms that the existing trend remains strong.
For example, during an uptrend, a higher low on price combined with a lower low on MACD can signal that buyers are still controlling the market.
Scalping Strategy with MACD Divergence and 50 EMA
Scalpers can use the MACD Divergence Indicator on the M5 and M15 charts by combining it with the 50 EMA as a trend filter.
This helps avoid taking divergence signals against the main market direction.
- Add a 50-period Exponential Moving Average to the chart.
- Only look for buy trades when price is above the 50 EMA.
- Only look for sell trades when price is below the 50 EMA.
- Wait for a MACD divergence signal in the same direction as the trend.
- Enter after a confirmation candle closes.
- Place the stop-loss behind the recent swing high or low.
- Target previous support or resistance levels.
Example: On the EUR/USD M5 chart, when price remains above the 50 EMA and forms a bullish hidden divergence, scalpers can look for a long entry after a bullish candle confirmation.
The 50 EMA filters out many weak reversal signals, while divergence helps identify moments when momentum returns.
For GBP/JPY M15, traders can wait for price below the 50 EMA, a bearish regular divergence, and a bearish confirmation candle before entering a short position.
This combination provides trend direction, momentum information, and entry timing.
Get Instant Free Access
Indicator Settings
- Fast EMA – Controls the fast MACD exponential moving average period.
- Slow EMA – Controls the slow MACD exponential moving average period.
- Signal SMA – Defines the MACD signal line period.
- Colors – Customize divergence lines and indicator appearance.
- Alert – Enable or disable trading notifications.
Important Notes
- Divergence signals work best when combined with trend analysis.
- Higher timeframes such as H1, H4, and Daily usually provide stronger setups.
- Scalpers should avoid trading every divergence signal without confirmation.
- The 50 EMA can help filter signals that go against the dominant trend.
- Use proper risk management on every trade.
- Always test strategies before applying them to live markets.









