
The MACD 4C indicator for MT5 is an enhanced version of the classic Moving Average Convergence Divergence (MACD) oscillator.
It retains the proven MACD calculation while displaying the histogram in four different colors, making it much easier to evaluate both market direction and momentum at a glance.
Rather than relying on a single histogram color, the MACD 4C visually separates strengthening and weakening bullish and bearish momentum.
This additional layer of information allows traders to react more quickly when momentum begins to accelerate or fade.
The indicator is suitable for every experience level and can be applied to any financial market supported by MetaTrader 5, including Forex, indices, commodities, and cryptocurrencies.
Why traders use the MACD 4C Indicator
Momentum plays a major role in trend trading.
A market may continue moving higher or lower, but without increasing momentum, the probability of a reversal often grows.
The MACD 4C helps identify these momentum shifts through its easy-to-read four-color histogram.
Many traders also use the indicator to identify bullish and bearish divergence.
When price creates a new high while the MACD histogram weakens, or price makes a lower low while momentum improves, it may signal that the current trend is losing strength.
Although divergence should never be traded on its own, it provides valuable confirmation when combined with price action and trend analysis.
Download This MT5 Indicator for Free
Indicator Chart Setup
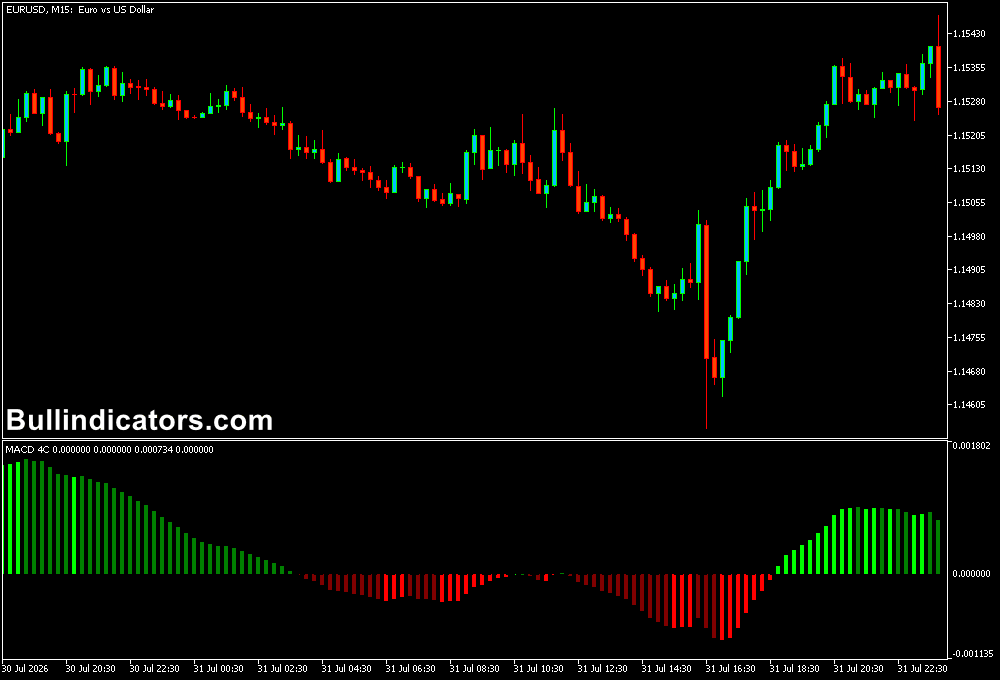
The MACD 4C appears in a separate window below the main price chart.
Histogram bars above the zero line are displayed in green and lime to represent bullish momentum, while bars below zero appear in red and maroon to indicate bearish momentum.
The changing colors make it easier to recognize whether momentum is strengthening or weakening before major price movements develop.
Core Features
- Four-color MACD histogram for improved momentum analysis.
- Highlights strengthening and weakening trends.
- Helps identify bullish and bearish divergence.
- Works on every MT5 timeframe.
- Suitable for Forex, indices, commodities, and cryptocurrencies.
- Easy to combine with other technical analysis tools.
Best for
- Momentum analysis.
- Trend confirmation.
- Divergence trading.
- Filtering trade entries.
- Multi-timeframe analysis.
Best Markets
- EUR/USD – One of the best choices for MACD analysis thanks to its smooth price movements and well-defined trends.
- GBP/JPY – High volatility creates strong momentum swings, making MACD histogram changes easier to interpret.
- XAU/USD (Gold) – Momentum shifts often develop before major price reversals, allowing the MACD 4C to provide valuable confirmation.
- US30 and NAS100 – Index trends frequently produce long momentum cycles where the four-color histogram clearly highlights strengthening and weakening moves.
- Crude Oil (WTI) – Useful for confirming momentum during breakout trades after periods of consolidation.
- Major Forex pairs – Liquid markets generally produce cleaner momentum signals and more reliable divergence patterns than exotic currency pairs.
Trading Styles
- Scalping on M5 and M15 with higher-timeframe confirmation.
- Intraday trading on M30 and H1 charts.
- Swing trading on H4 and Daily timeframes.
- Trend-following strategies across major Forex pairs.
- Momentum trading using multiple timeframe analysis.
How traders use it
A highly effective approach is to combine the MACD 4C with the Supertrend Indicator for MT5.
The Supertrend identifies the prevailing market direction, while the MACD 4C confirms whether momentum supports the trade.
Buy Rules:
- The Supertrend line must be green, confirming an uptrend.
- Wait until the MACD 4C histogram moves above the zero line or begins strengthening with green bullish bars.
- Enter after a bullish candle closes in the direction of the trend.
- Place the stop loss below the most recent swing low or below the Supertrend line.
- Take profit at the next resistance level, when a minimum 1:2 risk-to-reward ratio has been achieved, or when the MACD begins weakening while the Supertrend changes direction.
Sell Rules:
- The Supertrend line must be brown, confirming a bearish trend.
- Wait for the MACD 4C histogram to remain below the zero line or strengthen with bearish colors.
- Open a short position after bearish price confirmation.
- Place the stop loss above the previous swing high or above the Supertrend line.
- Take profit near the next support level, when the reward reaches at least twice the initial risk, or when momentum weakens and the Supertrend reverses.
Practical Example:
Imagine EUR/USD is trending higher on the H4 chart while the Supertrend remains green.
During a temporary pullback, the MACD histogram briefly weakens but stays close to the zero line.
As bullish momentum returns and the histogram changes back to stronger green bars, the continuation of the trend is confirmed, providing a higher-probability buying opportunity.
Get Instant Free Access
Indicator Settings
- InpFastEMA – Sets the period used to calculate the fast exponential moving average.
- InpSlowEMA – Defines the period of the slow exponential moving average.
- InpSignalEMA – Determines the period of the MACD signal line.
- Colors – Customizes the appearance of the four histogram colors.
Important Notes
- Trade MACD signals in the direction of the prevailing trend whenever possible.
- Divergence should always be confirmed with price action before entering a trade.
- Higher timeframes generally produce more reliable momentum signals.
- The indicator performs best when combined with a trend-following tool such as the Supertrend Indicator.
- Always use appropriate stop-loss placement and position sizing.
- Momentum confirmation can help reduce false breakout entries.









