
The Fractal Support Resistance Indicator for MT4 is an automatic horizontal support and resistance tool that identifies important price levels using fractal points.
Instead of manually searching for swing highs and swing lows, the indicator connects significant fractal areas and creates clear horizontal zones where price may react.
These levels help traders locate potential reversal areas, breakout zones, and important market decision points.
The indicator is based on price structure rather than fixed calculations, making it a useful alternative to traditional pivot-based support and resistance tools.
Because the levels are automatically generated and remain stable after candle confirmation, the indicator is suitable for intraday traders, scalpers, and swing traders who rely on price action.
Why traders use the Fractal Support Resistance Indicator
Support and resistance levels are among the most important concepts in technical analysis, but manually drawing them can be subjective.
Different traders may select different swing points, leading to inconsistent results.
The Fractal Support Resistance Indicator simplifies this process by automatically detecting important highs and lows and converting them into horizontal price zones.
These zones often represent areas where buyers and sellers previously showed strong interest.
Many traders use these levels to plan entries, place stop-loss orders, and identify realistic profit targets.
The indicator works particularly well when combined with candlestick patterns such as pin bars, engulfing candles, and rejection formations.
Download This MT4 Indicator for Free
Indicator Chart Setup
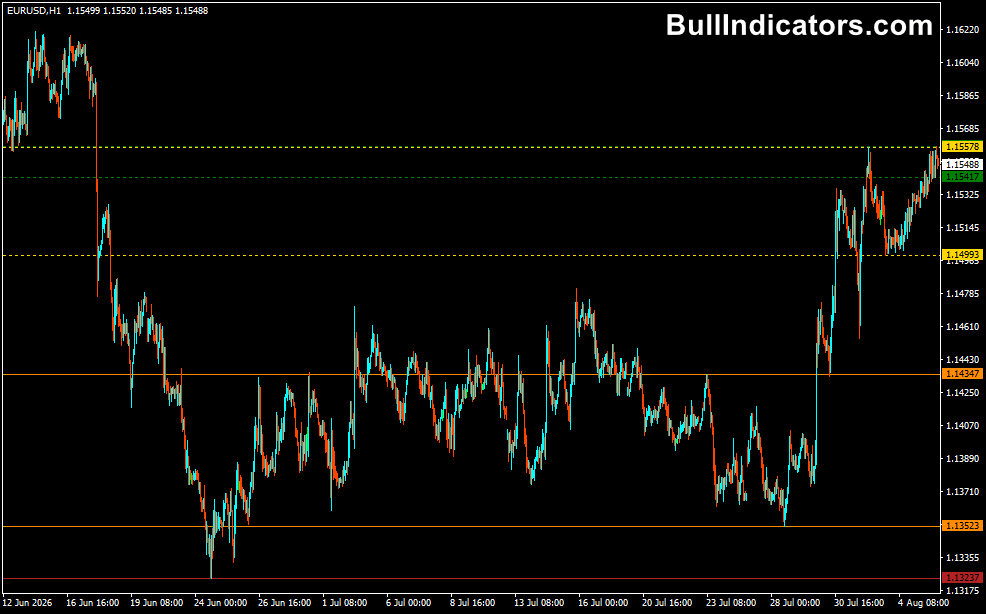
The indicator automatically draws horizontal support and resistance lines on the chart.
Stronger levels are highlighted with thicker colored lines, while additional fractal levels may appear as dotted lines.
These areas represent previous market turning points where price may react again.
The indicator can also be used on multiple timeframes, allowing traders to combine higher timeframe support and resistance with lower timeframe entry signals.
Core Features
- Automatically identifies fractal-based support and resistance zones.
- Draws horizontal price channels from important swing points.
- Helps locate reversal and breakout areas.
- Suitable for multi-timeframe analysis.
- Works with price action trading strategies.
- Provides clean chart-based market structure.
- Useful for scalping, day trading, and swing trading.
Best for
- Finding strong support and resistance zones.
- Planning breakout trades.
- Trading price action reversals.
- Identifying market reaction areas.
- Setting stop-loss and take-profit levels.
Best Markets
- EUR/USD for low-spread scalping opportunities.
- GBP/USD during London session volatility.
- GBP/JPY for strong intraday movements.
- Gold (XAU/USD) around major price levels.
- US30 and NAS100 index markets.
- Major Forex pairs with reliable liquidity.
Trading Styles
- Scalping.
- Intraday trading.
- Breakout trading.
- Range trading.
- Price action trading.
- Swing trading.
How traders use it
The most common approach is to observe how price reacts when reaching a fractal support or resistance zone.
During ranging markets, traders often look for reversal patterns at these levels.
For example, when price reaches fractal support and forms a bullish pin bar, buyers may be entering the market.
A buy trade can be considered after confirmation, with the stop-loss placed below the support zone.
When price reaches fractal resistance and creates a bearish rejection candle, traders may look for short opportunities with the stop-loss positioned above the resistance area.
The indicator can also identify breakout opportunities.
A strong candle closing above resistance may signal bullish continuation, while a close below support can indicate increasing selling pressure.
M1 and M5 Scalping Strategy Example
This strategy combines fractal support and resistance with simple price action for fast intraday trades.
- Use the M15 chart first to identify the main support and resistance zones.
- Move to the M1 or M5 chart for precise entries.
- Wait for price to approach a fractal support or resistance level.
- For buy trades, look for a bullish rejection candle or bullish engulfing pattern at support.
- For sell trades, wait for a bearish rejection candle at resistance.
- Enter after the confirmation candle closes.
- Place the stop-loss 3-5 pips beyond the fractal level on EUR/USD.
- Aim for 8-15 pips depending on volatility and spread.
Example: On EUR/USD M5, price approaches a strong fractal support level during the London session.
A bullish pin bar forms and closes above the level. A scalper enters a buy trade, places the stop-loss below support, and targets the next fractal resistance zone.
The trade is managed as long as price continues respecting the identified levels.
For GBP/JPY M1 scalping, traders can wait for price to reach a fractal resistance level after a strong upward move.
A bearish rejection candle followed by a lower close can provide a short entry opportunity toward the nearest support area.
Get Instant Free Access
Indicator Settings
- Colors – Customize the appearance of support and resistance lines.
Important Notes
- Wait for candle confirmation before trading from fractal levels.
- Higher timeframe levels are usually stronger than lower timeframe levels.
- Combine the indicator with price action for better entries.
- Breakouts should be confirmed with strong candle closes.
- Avoid trading directly during major news releases.
- Always use proper risk management when scalping.
- Test your strategy on a demo account before trading live.









