
The Pattern Recognition Master V3 Indicator for MT4 helps identify important candlestick formations directly on the price chart.
The tool labels recognized patterns as they appear, making it easier to incorporate candlestick analysis into a trading strategy.
It recognizes formations such as bullish and bearish engulfing patterns, hammers, shooting stars, Doji, stars, dark cloud cover and piercing lines.
The indicator can be particularly useful when these patterns are combined with trend direction, support and resistance, or another technical method.
Why traders use the Pattern Recognition Master V3 Indicator
Candlestick formations can provide valuable information about buying and selling pressure, but identifying them consistently on fast-moving charts can take time.
Pattern Recognition Master V3 places labels directly beside the relevant candles, allowing the market setup to be assessed without manually checking every formation.
One of its strongest applications is combining candlestick signals with trend confirmation.
A bullish pattern occurring during an established bullish trend can provide a more interesting setup than the same pattern appearing against strong downward momentum.
The indicator also supports alerts, allowing users to monitor selected formations without constantly watching the screen.
Download This MT4 Indicator for Free
Indicator Chart Setup
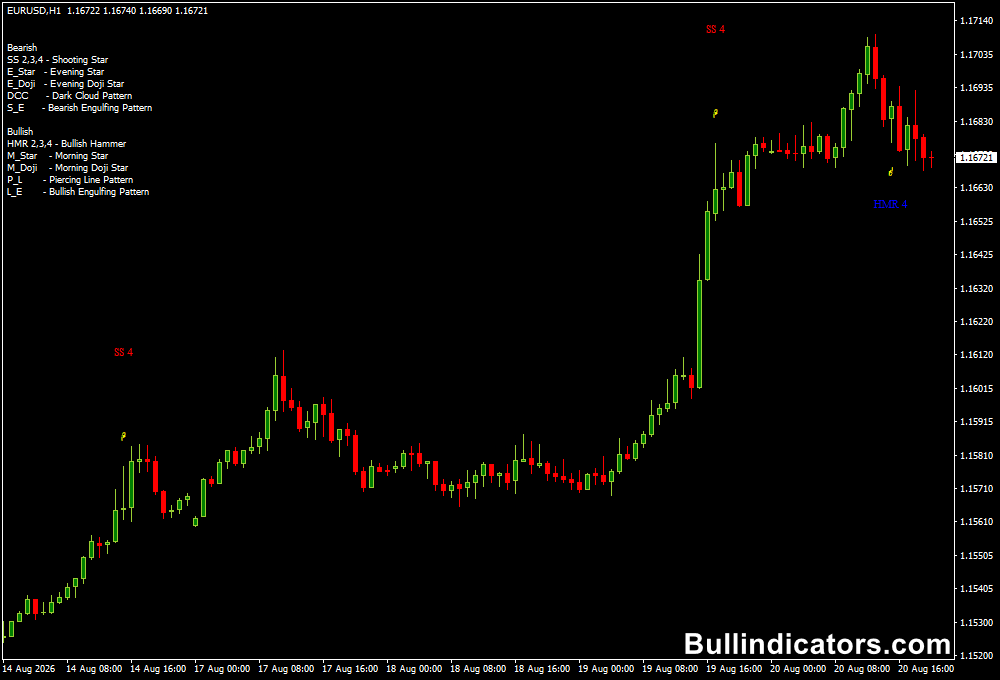
Once running on an MT4 chart, Pattern Recognition Master V3 places short labels around recognized candlestick formations.
A reference section on the chart explains the abbreviations used for the different patterns.
For example, S_E represents a bearish engulfing formation, while L_E represents a bullish engulfing formation.
Users can choose which formations should appear and configure individual alerts and colors.
This makes the display suitable for traders who prefer to concentrate on only a few high-value patterns.
Core Features
- Automatic recognition of multiple candlestick formations.
- Bullish and bearish pattern identification directly on the chart.
- Individual display controls for selected formations.
- Separate alert options for supported patterns.
- Custom colors for several candlestick formations.
- Useful for combining price action with trend analysis.
Best for
- Identifying bullish and bearish reversal formations.
- Confirming entries around support and resistance.
- Combining candlestick patterns with trend indicators.
- Intraday and swing trading setups.
- Monitoring multiple currency pairs for developing formations.
Best Markets
- EURUSD and GBPUSD for liquid intraday setups.
- USDJPY for trend-following candlestick combinations.
- GBPJPY when larger price movements create frequent formations.
- Gold (XAUUSD) for traders comfortable with higher volatility.
- Major FX pairs during the London and New York sessions.
Trading Styles
- Scalping on M5 and M15 charts with additional trend confirmation.
- Intraday trading on M15 and H1.
- Price action trading around important market levels.
- Swing trading using H4 and D1 confirmation.
How traders use it
A practical approach is to use the candlestick formation as the entry trigger while another tool determines the prevailing direction.
For example, the Pattern Recognition Master V3 can be combined with the Trend Line Indicator for MT4.
Consider EURUSD on an M1 chart.
If the trend indicator displays two blue lines, this can be treated as a bullish trend condition.
A bullish engulfing or hammer from Pattern Recognition Master V3 occurring during that trend can then provide a potential long setup.
- Buy example: EURUSD M1 shows two blue trend lines, confirming bullish conditions. A bullish engulfing pattern appears near a support area. After the candle closes, a trader can consider a buy, with the stop placed below the recent swing low.
- Sell example: EURUSD M1 shows two red trend lines, indicating bearish conditions. A bearish engulfing or shooting star forms near resistance. A sell can be considered after confirmation, with the stop positioned above the recent swing high.
Get Instant Free Access
Indicator Settings
- Show_Alert: Enables or disables the main alert function.
- Display_ShootStar_2/3/4: Controls the display of shooting star patterns.
- Show_ShootStar_Alert_2/3/4: Controls shooting star alerts.
- Color_ShootStar: Changes the shooting star color.
- Display_Hammer_2/3/4: Controls hammer pattern visibility.
- Show_Hammer_Alert_2/3/4: Enables or disables hammer alerts.
- Color_Hammer: Changes the hammer color.
- Display_Doji and Show_Doji_Alert: Controls Doji display and alerts.
- Display_Stars and Show_Stars_Alert: Controls star formations and alerts.
- Display_Dark_Cloud_Cover and Show_DarkCC_Alert: Controls dark cloud cover recognition and alerts.
- Display_Piercing_Line and Show_Piercing_Line_Alert: Controls piercing line recognition and alerts.
- Display_Bearish_Engulfing and Show_Bearish_Engulfing_Alert: Controls bearish engulfing signals.
- Display_Bullish_Engulfing and Show_Bullish_Engulfing_Alert: Controls bullish engulfing signals.
- Color settings: Customize the appearance of supported patterns.
- alertsMessage, alertsSound and alertsEmail: Configure message, sound and email notifications.
Important Notes
- Candlestick formations should be evaluated in the context of the prevailing trend.
- A bullish pattern during a strong bearish trend can produce a weak setup.
- Combining the patterns with support, resistance and trend direction can improve trade selection.
- Wait for the relevant candle to close before treating the formation as confirmed.
- Test the preferred patterns and settings on historical data before using them with live capital.









