
The No-Repaint Scalper indicator for MT4 is a price action-based trading tool designed to identify potential reversal points without changing previous signals.
The indicator analyzes recently closed candles and marks possible bullish and bearish turning points with arrows directly on the chart.
Unlike repainting indicators that modify historical signals after new price data appears, the No-Repaint Scalper Indicator focuses on confirmed candle formations.
It helps traders recognize rejection patterns, inside bars, and possible market turning zones before entering a trade.
The indicator is especially useful for scalpers and intraday traders who need quick information about possible changes in market momentum.
However, the best results come from combining the signals with a reliable trend filter and proper market analysis.
Why traders use the No-Repaint Scalper Indicator
Many traders struggle to interpret price behavior around important support and resistance levels.
A breakout may appear convincing, only for the market to reverse shortly afterward.
These false moves often occur because traders enter without understanding the underlying price action.
The No-Repaint Scalper Indicator helps solve this problem by highlighting candles that show potential rejection.
The arrows act as a visual guide, showing where buyers or sellers may be gaining control.
The indicator focuses on real-time price behavior by analyzing candle formations.
A bearish rejection candle near resistance can warn that buyers are losing strength, while a bullish rejection candle near support may indicate increasing buying pressure.
Its main advantages include:
- Non-repainting arrow signals.
- Simple chart interpretation.
- Helps identify reversal zones.
- Suitable for scalping and intraday trading.
- Works on Forex, stocks, and other markets.
- Can be combined with trend indicators.
Download This MT4 Indicator for Free
Indicator Chart Setup
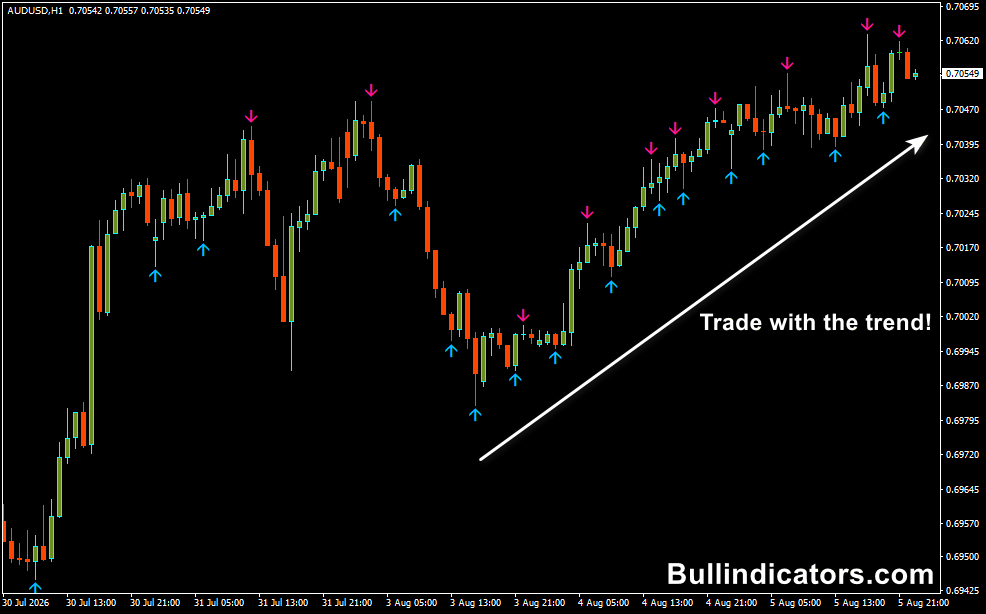
The No-Repaint Scalper Indicator places arrows above or below price candles when it detects potential reversal patterns.
A bullish signal appears below the candle when price shows rejection from lower levels.
This suggests buyers may be entering the market.
A bearish signal appears above the candle when price rejects higher levels, indicating possible selling pressure.
The arrows are calculated from completed candle information, helping traders avoid the common problem of signals moving after the trade opportunity has already passed.
Core Features
- Non-repainting trading signals.
- Detects potential bullish and bearish reversals.
- Uses candle structure and price rejection patterns.
- Displays easy-to-read arrows.
- Works on all MT4 timeframes.
- Suitable for scalping and day trading.
- Can be combined with trend analysis tools.
Best for
- Short-term reversal trading.
- Scalping entries.
- Support and resistance strategies.
- Price action confirmation.
- Finding possible market turning points.
Best Markets
- EUR/USD for low spread scalping.
- GBP/USD during active London session movements.
- GBP/JPY for strong intraday volatility.
- Gold (XAU/USD) around important price zones.
- NASDAQ and indices during high-volume sessions.
- Major Forex pairs with strong liquidity.
Trading Styles
- Scalping.
- Intraday trading.
- Price action trading.
- Reversal trading.
- Support and resistance trading.
- Multi-timeframe analysis.
How traders use it
The No-Repaint Scalper Indicator works best when traders combine the arrow signals with market context.
A signal appearing in the middle of a sideways market has less value than a signal appearing at an important support or resistance zone.
For example, if price reaches a strong resistance area and forms a bearish rejection candle, a red arrow above the candle can provide a possible short entry opportunity.
Traders can wait for price to break the low of the signal candle before entering.
For buy setups, traders can look for a bullish arrow below a candle after price tests support.
The entry can be taken after confirmation, with the stop-loss placed below the recent swing low.
Trend Confirmation Strategy with Heiken Ashi Smoothed
The No-Repaint Scalper Indicator should be combined with a trend indicator such as the Heiken Ashi Smoothed Indicator to avoid trading against the dominant market direction.
The Heiken Ashi Smoothed indicator makes trend direction easier to identify through candle colors:
- A series of green candles indicates an established bullish trend.
- A series of red candles indicates an established bearish trend.
Example strategy on EUR/USD M5:
- Add the Heiken Ashi Smoothed indicator to the M5 chart.
- Only search for buy signals when a series of green Heiken Ashi candles appears.
- Wait for the No-Repaint Scalper Indicator to print a bullish arrow below a candle.
- Enter after the signal candle closes.
- Place the stop-loss below the recent swing low.
- Target the next resistance zone or use a fixed risk-to-reward ratio.
For sell trades, wait until Heiken Ashi Smoothed displays a series of red candles.
When the No-Repaint indicator prints a bearish arrow above price during the bearish trend, traders can look for a short entry.
Example: On GBP/USD M15, price is moving below the Heiken Ashi Smoothed trend direction with consecutive red candles.
The market retraces toward a resistance zone, then the No-Repaint indicator creates a bearish arrow above a rejection candle.
This combination provides a higher-quality setup because the reversal signal follows the main trend.
Using the No-Repaint Scalper Indicator alone can produce weak signals during ranging markets.
Combining it with a trend filter helps remove many low-quality entries.
Get Instant Free Access
Indicator Settings
- Arrow Distance – Controls the distance between price candles and the displayed arrows.
- Colors – Allows customization of arrow colors.
- Arrow Style – Changes the appearance of signal arrows.
Important Notes
- The indicator does not predict future price movement.
- Use signals together with trend direction and market structure.
- Avoid trading every arrow during sideways conditions.
- Support and resistance levels improve signal quality.
- Higher timeframe analysis can improve lower timeframe entries.
- Always apply proper risk management.
- Test the strategy on a demo account before live trading.









