
The Heiken Ashi Smoothed indicator for MT4 is a trend-following tool that displays modified candlestick bars to show the current market direction.
By applying moving average calculations to the traditional Heiken Ashi formula, the indicator reduces short-term price noise and creates smoother trend signals.
The indicator uses green and red bars to represent bullish and bearish market conditions.
When momentum shifts, the candle colors change, helping traders recognize possible trend transitions and manage their positions more effectively.
Heiken Ashi Smoothed is popular among traders who prefer a cleaner view of price action.
It can be used for identifying trends, staying in profitable moves, and locating possible exit points when market momentum starts changing.
Why traders use the Heiken Ashi Smoothed Indicator for MT4
Regular candlestick charts often contain short-term fluctuations that can make it difficult to identify the true market direction.
The Heiken Ashi Smoothed Indicator filters some of this noise by using moving averages, creating a smoother representation of price movement.
Green bars indicate bullish conditions, while red bars highlight bearish momentum.
This simple visual approach allows traders to quickly understand whether buyers or sellers are currently controlling the market.
The indicator is also useful for trade management.
Traders can stay with a position while the trend color remains unchanged and monitor a color shift as a possible signal that momentum is weakening.
Download This MT4 Indicator for Free
Indicator Chart Setup
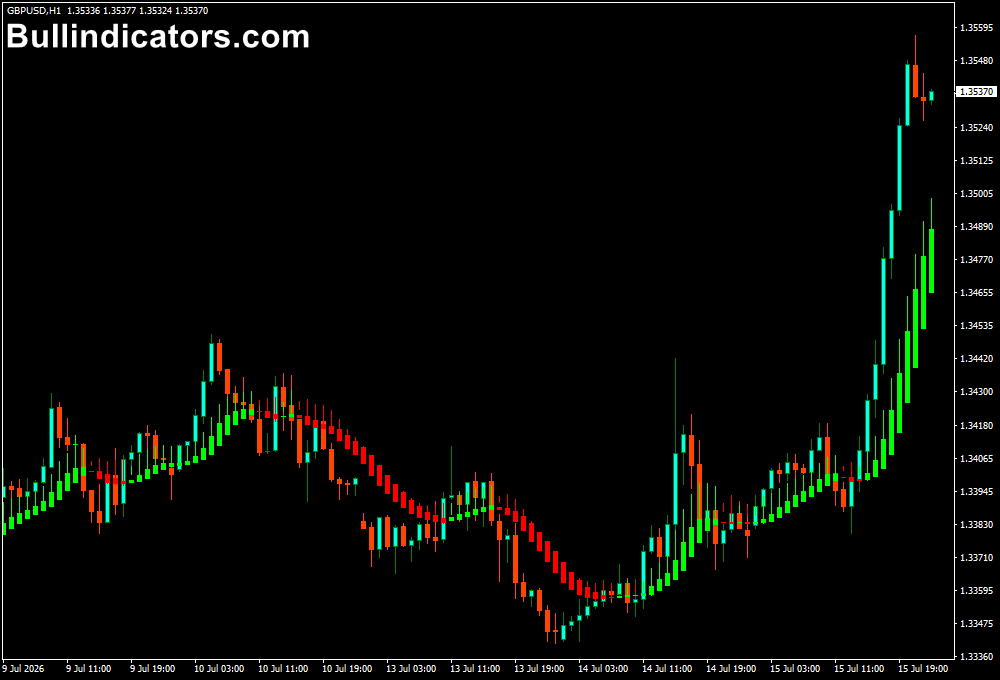
After installing the indicator on an MT4 chart, the normal candlesticks are replaced by smoothed Heiken Ashi bars.
Green bars represent upward market movement, while red bars show downward movement.
The smoothing process creates a clearer trend view by reducing smaller price fluctuations.
During strong trends, traders may see a series of the same colored bars, while changing colors can highlight possible market reversals.
The indicator can be applied to different timeframes, allowing traders to analyze short-term movements as well as larger market trends.
Core Features
- Displays smoothed bullish and bearish price bars.
- Reduces short-term market noise.
- Uses moving averages for additional smoothing.
- Highlights possible trend changes.
- Provides a simple visual trend filter.
- Suitable for trend-following strategies.
- Works across multiple MT4 timeframes.
- Customizable appearance settings.
Best for
- Identifying the current market trend.
- Following strong directional moves.
- Filtering noisy price action.
- Managing open trades.
- Combining candle analysis with other trading methods.
Best Markets
- Forex pairs with consistent directional movement.
- Major currency pairs during active sessions.
- Gold (XAUUSD), where smoother trend visualization can help manage volatility.
- Indices that develop extended bullish or bearish moves.
- Markets where traders prefer trend confirmation over rapid signals.
Trading Styles
- Scalping on M5 and M15 charts when using faster settings.
- Intraday trading on M15, M30, and H1 charts to follow session trends.
- Swing trading on H1 and H4 timeframes for larger market movements.
- Position trading on Daily charts to follow long-term trends.
- Trend-following strategies where trades remain open while the candle color stays consistent.
How traders use it
The basic approach with the Heiken Ashi Smoothed Indicator is to follow the color direction.
When green bars appear, traders look for potential buying opportunities. When red bars form, traders focus on possible selling setups.
The indicator can also be used for trade exits.
A trader holding a buy position may continue following the move while green bars remain visible.
If the bars change to red, it can signal that bullish momentum is fading and the trade should be reviewed.
For better trade selection, traders often combine the indicator with additional market analysis.
The smoothed candles help identify direction, while other technical tools can be used to evaluate entry timing, support and resistance areas, or market conditions.
Get Instant Free Access
Indicator Settings
- MaMetod: Selects the calculation method for the first moving average.
- MaPeriod: Defines the period of the first moving average.
- MaMetod2: Selects the calculation method for the second moving average.
- MaPeriod2: Defines the period of the second moving average.
- Colors: Adjusts the bullish and bearish bar colors.
- Line Style: Changes the display style of indicator elements.
Important Notes
- The indicator is designed to identify trends, not predict exact market tops and bottoms.
- Smoothed candles may react slower than traditional price candles during fast market movements.
- Longer moving average periods create smoother but slower signals.
- Shorter settings react faster but may produce more frequent color changes.
- Always consider overall market conditions before entering a trade.
- Use proper risk management with every trading strategy.









