
The Scalper Signal indicator for MT4 is designed for short-term Forex analysis, with a focus on identifying changes in price momentum and potential directional moves.
It places green and red arrows directly on the price chart, making it easy to spot bullish and bearish conditions without adding multiple panels below the chart.
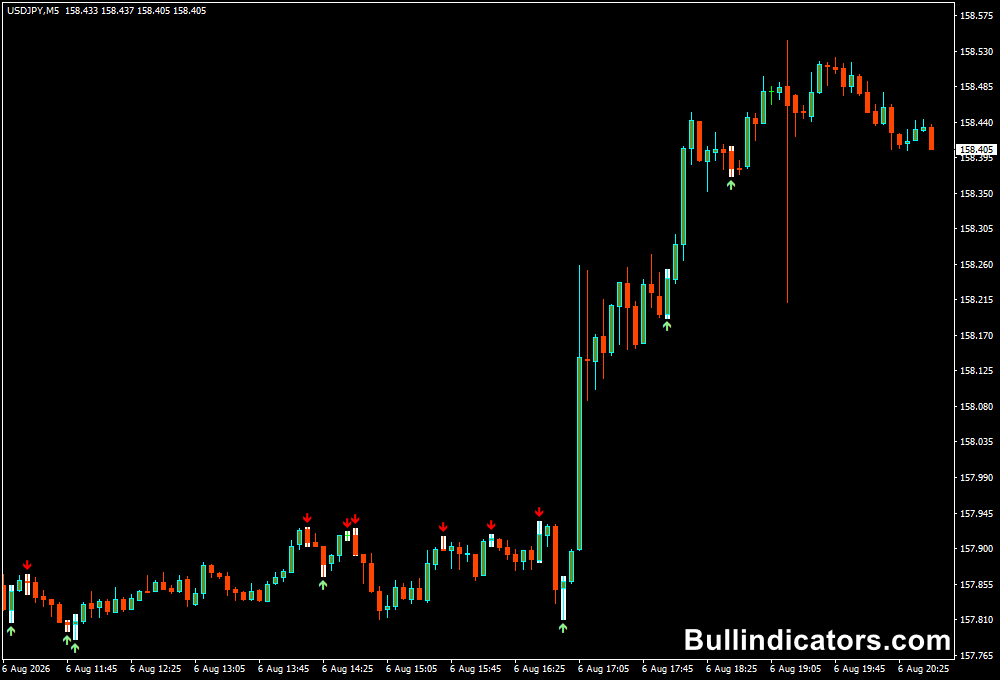
A green arrow appears below a candle when the calculated conditions point toward upward momentum, while a red arrow is displayed above the candle when downward pressure is detected.
The tool is particularly suited to fast-moving charts such as M1, M5 and M15, where timing is important for scalping and intraday setups.
Why traders use the Scalper Signal Indicator
The main advantage is its simple presentation. Rather than interpreting several separate readings, the signals are displayed directly around the candles.
This can help with identifying potential entry areas, managing existing positions and recognizing when short-term momentum may be changing.
The sensitivity setting can also be adjusted to suit different market conditions.
A lower or higher sensitivity can produce a different frequency of signals, so it is worth experimenting with the setting on a demo chart before using it in a live trading plan.
For better results, use the signals in the direction of the broader market trend.
A green arrow on an M5 chart has more relevance when the higher timeframe is bullish, while red signals become more interesting when the wider trend is bearish.
Download This MT4 Indicator for Free
Indicator Chart Setup
Once running on an MT4 price chart, the Scalper Signal Indicator displays colored arrows around the candlesticks.
Green arrows appear beneath price and represent potential bullish signals. Red arrows appear above price and represent potential bearish signals.
For example, on a USD/JPY M5 chart, a green arrow below a candle can be treated as a possible long setup when price is already moving within an established upward trend.
A red arrow above a later candle may signal weakening momentum or an opportunity to consider closing the long position.
A short entry becomes more compelling when the broader trend is also pointing lower.
Core Features
- Green arrows for potential bullish momentum.
- Red arrows for potential bearish momentum.
- Signals are plotted directly on the price chart.
- Designed with short-term trading in mind.
- Adjustable filter sensitivity.
- Works across different MT4 timeframes and currency pairs.
Best for
- Spotting short-term changes in price momentum.
- Finding potential scalping entry and exit areas.
- Monitoring directional moves on M1, M5 and M15 charts.
- Timing entries after a broader trend has been established.
Best Markets
- EUR/USD – well suited to M1 and M5 scalping during active European and US sessions.
- GBP/USD – useful when stronger intraday momentum develops.
- GBP/JPY – suitable for experienced scalpers comfortable with larger price swings.
- Gold (XAU/USD) – can be tested for short-term momentum setups, particularly during active sessions.
Trading Styles
- Forex scalping on M1 and M5 charts.
- Intraday momentum trading on M5 and M15.
- Trend-following entries using higher timeframe confirmation.
- Short-term position management and exit timing.
How traders use it
The basic approach is to wait for an arrow and then assess the surrounding price action before entering.
A green signal can support a long setup when price is holding above important support and the higher timeframe trend is bullish.
A red signal can support a short setup when price is trading below resistance and the larger trend remains bearish.
On an M5 EUR/USD chart, for example, suppose H1 price action is bullish.
A trader can wait for a temporary pullback on M5 and look for a new green arrow as momentum turns upward.
The trade can then be protected below a recent swing low, with the target based on nearby resistance or a predefined risk-to-reward ratio.
It is also important to test the sensitivity parameter.
The default value is 2, but different markets and trading speeds may require a different setting.
Spend some time adjusting the sensitivity to match your trading style and preferred signal frequency.
Get Instant Free Access
Indicator Settings
- FS: Controls the filter sensitivity used when calculating the signals.
- Sensitivity: The default value is 2 and determines how responsive the signal calculation is to price movement.
- Higher sensitivity settings can be tested when seeking a different signal frequency.
- Lower sensitivity settings may be useful when looking for a more selective approach.
Important Notes
- Do not treat every arrow as an automatic buy or sell order.
- Wait for price momentum and the surrounding trend to support the signal.
- The tool can occasionally repaint two successive arrows of different colors, so allowing the trend to develop can reduce premature entries.
- Higher timeframe direction should be considered before taking an M1 or M5 signal.
- Test different sensitivity values on historical charts and a demo account before applying the setup to live trading.









