
The Trend Strength indicator for MT4 is a momentum-based tool that measures the strength of the prevailing market trend.
Rather than focusing only on whether price is moving higher or lower, it provides a percentage reading that helps assess how strongly the market is moving in that direction.
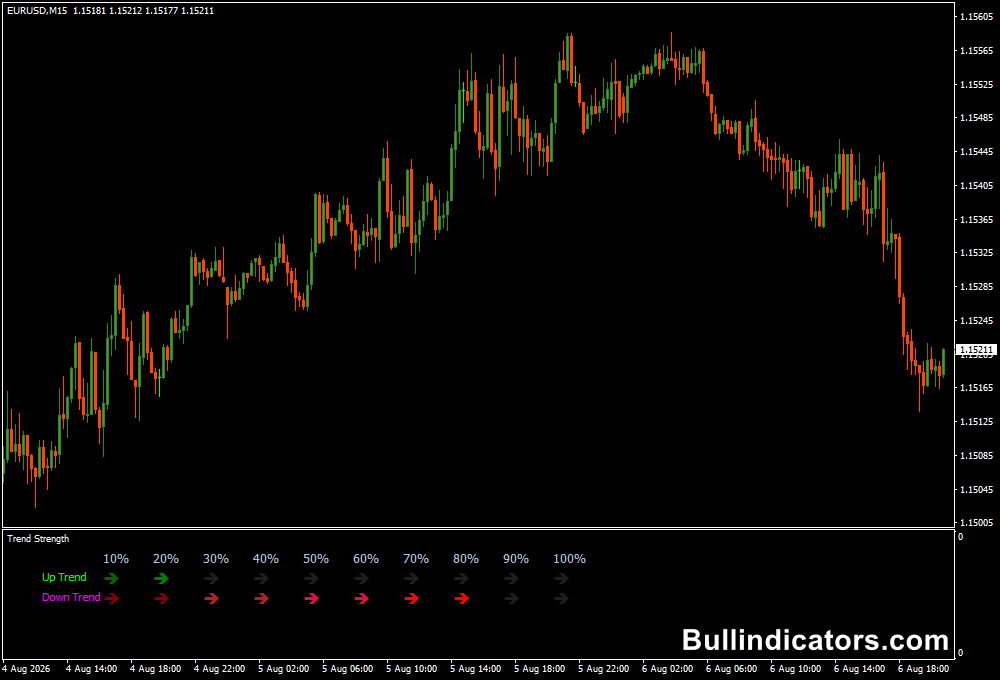
The display uses green and red arrows to identify developing bullish and bearish trends, with percentage readings increasing as momentum develops.
This makes it useful for assessing whether a move has enough strength to justify staying with a position or whether market conditions are becoming less directional.
Why traders use the Trend Strength Indicator
Trend direction alone does not tell you how much momentum is behind a move.
A currency pair can be rising while momentum remains weak, or it can accelerate rapidly as buying pressure increases.
The Trend Strength Indicator addresses this by presenting trend strength as a percentage from 10% to 100%.
Green readings point toward an upward trend, while red readings indicate downward momentum.
Increasing percentages can help confirm that a directional move is gaining strength.
Lower readings can be useful when assessing whether the market lacks sufficient momentum and may be moving sideways.
This makes the tool suitable as a confirmation method alongside a broader trading strategy.
For example, a bullish price-action setup can carry more weight when the Trend Strength reading is increasing on the upside.
It is also worth comparing the reading across timeframes so that short-term entries are aligned with the broader market direction.
Download This MT4 Indicator for Free
Indicator Chart Setup
The indicator displays colored arrows and percentage readings that develop as the trend progresses.
Green arrows represent bullish conditions and red arrows represent bearish conditions.
Both directions begin at 10% by default, with additional percentage levels appearing as the measured trend becomes stronger.
A sequence of increasing green percentages can therefore indicate strengthening upside momentum, while rising red percentages suggest increasing downside pressure.
When readings remain relatively weak, price may be lacking a strong directional bias and could be entering a ranging phase.
Core Features
- Measures trend strength using percentage readings from 10% to 100%.
- Green arrows identify bullish market conditions.
- Red arrows identify bearish market conditions.
- Percentage readings develop as the trend progresses.
- Helps distinguish stronger directional markets from weaker conditions.
- Can be combined with price action and other technical methods.
Best for
- Assessing the momentum behind an existing trend.
- Confirming directional setups before entering a position.
- Monitoring whether a trend is gaining or losing strength.
- Filtering potential trades during weak or ranging conditions.
Best Markets
- EUR/USD and GBP/USD for liquid intraday trend setups.
- USD/JPY when sustained directional momentum develops.
- GBP/JPY for higher-volatility trend moves.
- Gold (XAU/USD) for momentum-based intraday and swing analysis.
- Major Forex pairs during the London and New York sessions.
Trading Styles
- Intraday trend following on M15 and H1.
- Scalping when short-term momentum is strong.
- Swing trading with H4 and D1 trend confirmation.
- Momentum-based trade filtering.
- Trend continuation strategies.
How traders use it
The most practical approach is to combine the percentage reading with the direction of price.
A green arrow with increasing strength can support a long setup when the market is making higher highs and higher lows.
Conversely, increasing red readings can confirm bearish price action when sellers are maintaining control.
For example, on an H1 EUR/USD chart, a trader may identify an established bullish trend and then wait for the Trend Strength reading to move progressively higher.
If the percentage rises from 20% toward 50% and beyond while price continues to hold above previous support, the reading can provide additional confirmation for maintaining a long position.
How to scalp with it?
For scalping, consider an M5 chart during the London session.
Suppose EUR/USD breaks above a short-term resistance level while the Trend Strength Indicator displays green readings that increase from 10% toward 30% or 40%.
A scalper could use the combination of the breakout, bullish price action and increasing momentum as confirmation for a long setup.
A protective stop could be placed below the latest M5 swing low, with the trade managed around nearby resistance or a predefined risk-to-reward target.
It is generally preferable to trade in the direction of the broader trend.
An M5 buy signal has stronger context when the H1 or H4 market is also bullish.
When the percentage readings remain low and price repeatedly reverses around the same levels, patience may be more appropriate because the market could be ranging.
Get Instant Free Access
Indicator Settings
- Colors: Controls the colors used by the indicator for its displayed readings and signals.
- Style: Controls the visual presentation of the indicator on the MT4 chart.
- The default trend-strength scale begins at 10% and can progress toward 100% as momentum develops.
Important Notes
- A high percentage reading should not be treated as a standalone entry signal.
- Use price action and higher timeframe direction to confirm the market bias.
- Low readings can indicate limited momentum or a ranging environment.
- Strong trends can continue for extended periods, so avoid exiting solely because a position has already produced a substantial gain.
- Test the tool with your existing strategy to determine which percentage levels provide the most useful confirmation for your trading approach.









