
The Volatility Quality Zero Line indicator for MT4 combines trend direction and volatility analysis in one chart tool.
Its colored line moves around a central zero level, with green indicating bullish conditions and red indicating bearish conditions.
The distance from the zero line also provides an indication of how much volatility is present in the market.
This version is based on the Volatility Quality concept developed by Thomas Stridsman, but uses a less sensitive calculation designed to reduce the number of signals.
It uses Open, High, Low and Close values together with a Weighted Moving Average to derive its readings.
The lower sensitivity can help filter some short-lived moves, although it also means that signals may arrive later than those from faster momentum tools.
Why traders use the Volatility Quality Zero Line Indicator
The combination of trend direction and volatility makes this tool useful for deciding whether a market has enough momentum to justify following a directional move.
When the line turns green and crosses above zero, bullish conditions are developing.
When it turns red and moves below zero, bearish conditions are indicated.
The distance from zero provides additional information.
A line that moves substantially away from the zero level suggests stronger market movement, while readings close to zero indicate relatively limited momentum.
This can help distinguish a developing trend from a market that is moving sideways.
Because the calculation is less sensitive, the indicator produces fewer signals than a faster version of the Volatility Quality approach.
This can be useful for trend-following strategies where filtering minor price fluctuations is more important than catching every short-term movement.
Download This MT4 Indicator for Free
Indicator Chart Setup
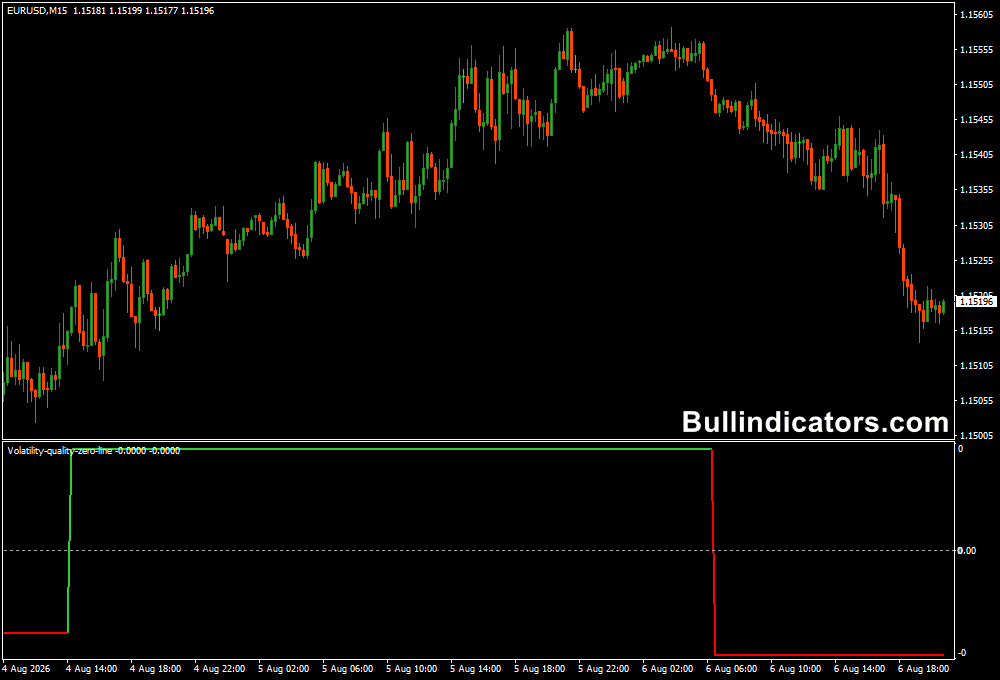
The Volatility Quality Zero Line appears in a separate MT4 window as a colored line that moves around the zero level.
A green line represents bullish conditions, while a red line represents bearish conditions.
A transition from red to green coincides with a move through the zero line and can signal the beginning of a bullish phase.
A transition from green to red occurs when the line moves through zero in the opposite direction.
The strength of the move can be assessed by observing how far the line travels from the central level.
Core Features
- Identifies bullish and bearish market conditions.
- Green line indicates an upward trend.
- Red line indicates a downward trend.
- Zero-line crossings mark changes in directional bias.
- Distance from zero provides volatility context.
- Less sensitive than the original Volatility Quality approach.
- Adjustable smoothing and filtering parameters.
Best for
- Trend-following strategies.
- Monitoring volatility alongside market direction.
- Filtering weaker price movements.
- Identifying broad bullish and bearish phases.
- Confirming directional setups with another trend method.
Best Markets
- Major Forex pairs, particularly liquid instruments with well-defined directional moves.
- Minor and cross-currency pairs can also be suitable when sustained trends develop.
- Commodity currencies such as AUD, CAD and NZD pairs can work well during strong macro-driven moves.
- Gold, silver and other actively traded commodities can be tested when volatility expands.
- Major stock indices are suitable for trend-following during strong directional sessions.
- Highly liquid markets generally provide the most useful conditions because the indicator is designed to follow broader momentum rather than very short-lived price fluctuations.
- For intraday trading, M15 and H1 charts can provide a good balance between signal frequency and trend quality, while H4 and D1 are better suited to larger market moves.
Trading Styles
- Intraday trend following on M15 and H1.
- Swing trading on H4 and D1.
- Momentum-based position management.
- Multi-timeframe trend confirmation.
- Short-term trading when combined with a faster entry tool.
How traders use it
A basic strategy is to trade the color change and confirm that the line has crossed the zero level.
For a bullish setup, wait for the line to change from red to green.
For a bearish setup, wait for the line to change from green to red.
The recent market structure can then be used for risk management.
After a bullish signal, the latest meaningful swing low can provide a reference for a protective stop.
Following a bearish signal, the most recent swing high can serve the same purpose.
Trading Strategy with MA Crossover Alert Indicator
For a more selective approach, the Volatility Quality Zero Line can be combined with the MA Crossover Alert Indicator for MT4.
The MA Crossover Alert provides white arrows that can be used to confirm the direction established by the Volatility Quality reading.
Buy Rules
- Wait for the Volatility Quality Zero Line to turn green and cross above zero.
- Confirm that the white UP arrow from the MA Crossover Alert Indicator appears.
- Prefer the setup when price is also trading above the relevant moving-average area.
- Enter long after the bullish conditions align.
- Place the stop below the latest significant swing low.
- Consider taking profit when the Volatility Quality line turns red or when the trend structure breaks.
Sell Rules
- Wait for the Volatility Quality Zero Line to turn red and cross below zero.
- Confirm that a white down arrow from the MA Crossover Alert Indicator appears.
- Prefer the setup when price is also trading below the relevant moving-average area.
- Enter short after the bearish conditions align.
- Place the stop above the latest significant swing high.
- Consider taking profit when the Volatility Quality line turns green or bearish market structure fails.
For example, on an M15 EUR/USD chart, the Volatility Quality line changes from red to green and moves above zero.
A white UP arrow then appears from the MA Crossover Alert tool.
If price is also holding above the moving-average area, the combination provides three supporting factors: bullish momentum, a directional trend signal and moving-average confirmation.
Get Instant Free Access
Indicator Settings
- Price Smoothing: Controls how responsive the signals are. The default value is 15. Higher values create smoother, less volatile signals, while lower values increase responsiveness.
- Price Smoothing Method: Offers three methods: 1, 2 and 3. Method 2 produces the smoothest line and fewer signals, making it suitable for following major trends. Methods 1 and 3 generate more frequent signals.
- Filter: Controls additional smoothing. Higher values reduce the number of signals and filter more short-term price fluctuations.
Important Notes
- The Volatility Quality Zero Line is deliberately less sensitive, so entries can occur later than with faster trend tools.
- A line close to zero generally indicates limited directional momentum and requires additional confirmation.
- Large movement away from zero can indicate stronger volatility, but does not guarantee that the trend will continue.
- If the latest swing point is too far away to provide a sensible risk-to-reward ratio, it may be better to skip the setup.
- Higher smoothing settings can reduce noise but may also delay trend changes.
- Use the MA Crossover Alert confirmation as part of a complete trading plan rather than treating either signal as a guaranteed entry.









