
The Waddah Attar Explosion Indicator for MT5 combines trend direction and momentum into one indicator window.
Its histogram changes color according to the prevailing directional movement, while an explosion signal line provides a threshold for judging whether momentum is strong enough to support a trade.
Green histogram bars indicate bullish pressure, while red bars indicate bearish pressure.
When the bars expand and move beyond the explosion threshold, the market is showing stronger directional momentum.
This makes the indicator particularly useful for identifying expanding moves after periods of consolidation and filtering out weaker market conditions.
Why traders use the Waddah Attar Explosion Indicator
The indicator is useful because it does more than identify whether price is moving higher or lower.
It also measures the strength behind that movement.
A series of expanding green bars above the threshold can indicate increasing bullish momentum, while expanding red bars above the threshold can point to strengthening bearish pressure.
The explosion line provides an additional filter.
When the histogram remains below the threshold, there may not be enough momentum to justify a directional trade.
This can help avoid entering during quiet or ranging conditions where price repeatedly moves without developing a sustained trend.
Another advantage is its flexibility.
The indicator can be applied to Forex pairs, indices, commodities and other instruments across short-term and higher timeframes.
Download This MT5 Indicator for Free
Indicator Chart Setup
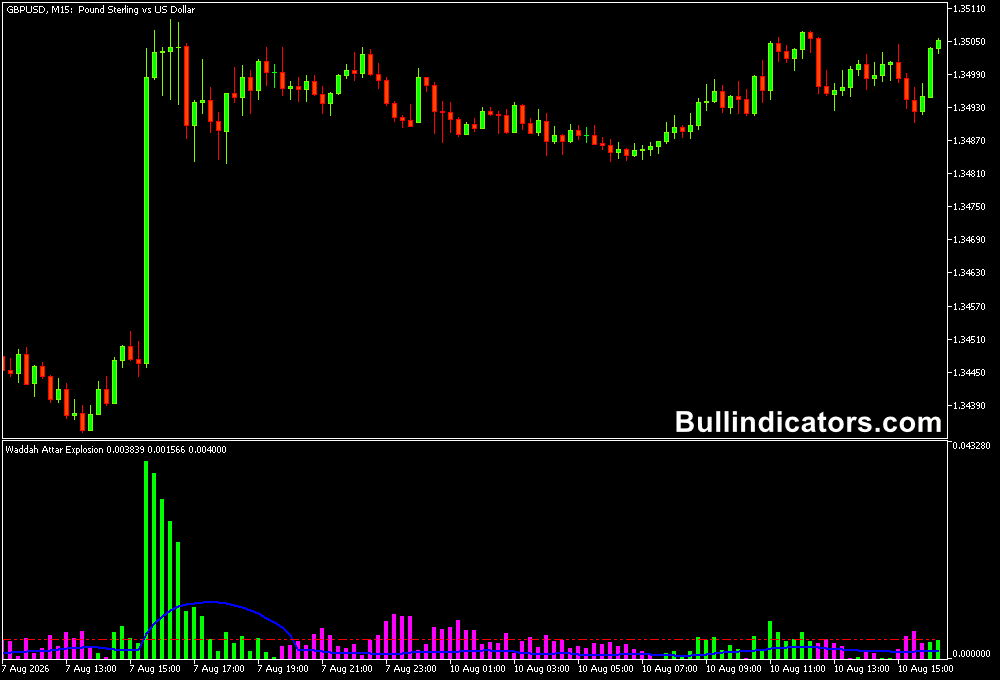
The Waddah Attar Explosion Indicator appears in a separate window below the MT5 price chart.
The main component is a colored histogram accompanied by an explosion threshold line.
Long green histogram bars represent bullish directional momentum, while red bars represent bearish pressure.
The length of the bars helps assess momentum, with larger bars showing a stronger move.
The threshold line acts as a reference level. When the histogram moves above this level, the directional move has greater momentum behind it.
A flat threshold combined with small histogram bars below the threshold generally indicates that market conditions are less suitable for directional entries.
Core Features
- Green and red histogram bars identify bullish and bearish momentum.
- Explosion threshold helps filter weak directional movements.
- Increasing histogram size highlights expanding momentum.
- Combines trend direction and momentum analysis.
- Suitable for breakout and trend-following strategies.
- Adjustable MACD and Bollinger Band calculation periods.
- Customizable sensitivity, explosion power and trend-strength parameters.
- Optional warning window through the Alert Count setting.
Best for
- Identifying momentum expansion following quiet market periods.
- Filtering potential trades when momentum remains below the threshold.
- Confirming breakouts with increasing directional pressure.
- Following established trends while histogram momentum remains elevated.
- Detecting when a directional move is losing strength through shrinking histogram bars.
Best Markets
- EURUSD: Useful for catching directional intraday moves when European and Asian market activity overlaps.
- AUDUSD: Suitable for trend and breakout analysis during the Asian session and early London trading.
- GBPUSD: Effective for momentum setups around major London-session price movements.
- US30: Can be applied to strong index moves during the New York session.
- NASDAQ: Useful when volatility expands following a consolidation or market-opening breakout.
- Crude Oil: The indicator can help assess momentum when energy markets produce sharp directional moves.
Trading Styles
- Breakout trading: M15 and H1 charts can be used to identify expanding momentum after a consolidation range.
- London momentum trading: M5 GBPUSD or EURJPY setups can focus on histograms breaking above the threshold as volatility increases.
- New York index trading: M5 and M15 charts can be used on US30 or NASDAQ when the session produces strong directional expansion.
- Trend continuation: H1 and H4 charts can help identify whether an existing trend still has sufficient momentum.
- Short-term reversal confirmation: M1 and M5 charts can be monitored for a color change accompanied by a significant change in histogram strength.
How traders use it
A bullish setup develops when the histogram forms progressively longer green bars and moves above the explosion threshold.
This indicates that upward momentum is becoming more significant.
A BUY entry can be considered when the histogram breaks the threshold alongside a bullish price breakout or other price-action confirmation.
For a bearish setup, look for progressively longer red bars that rise above the threshold.
A SELL entry can be considered when bearish momentum is confirmed by a break below a recent support level or another bearish price signal.
Stop-loss placement can be based on the price structure surrounding the entry.
For a BUY, the recent swing low or breakout candle can provide a reference point.
For a SELL, the recent swing high can be used.
Positions can be managed while the histogram remains strong, with an exit considered when momentum contracts significantly or the histogram changes direction.
The indicator is also useful for avoiding poor conditions.
If the threshold is relatively flat and the histogram remains below it, there is little evidence of strong momentum.
Waiting for the histogram to expand beyond the threshold can produce more selective entries.
M5 Waddah Attar Scalping with Trend Scalp Indicator
The Waddah Attar Explosion Indicator can be combined with the Trend Scalp Indicator to create a two-step M5 scalping method.
The Trend Scalp Indicator is used to identify the short-term directional bias, while the Waddah Attar Explosion confirms whether sufficient momentum is entering the move.
BUY setup
First, look for a bullish condition on the Trend Scalp Indicator.
The reading should move into positive territory, showing that short-term momentum has turned upward.
Next, check the Waddah Attar Explosion.
Wait for the histogram to form expanding green bars and move above the explosion threshold.
This combination shows that the M5 trend is bullish and that momentum is supporting the move.
- Use the M5 chart on a liquid pair such as EURUSD or GBPUSD.
- The Trend Scalp Indicator moves above its neutral level, confirming bullish momentum.
- Wait for the Waddah Attar Explosion to produce green histogram bars.
- The green histogram should expand above the explosion threshold.
- Enter BUY after the bullish momentum is confirmed.
- Place the stop loss below the latest M5 swing low or pullback low.
- Consider taking profit near the next resistance area or when the Waddah histogram begins to contract significantly.
SELL setup
The Trend Scalp Indicator should move into negative territory, establishing bearish short-term momentum.
The Waddah Attar Explosion should then produce expanding red histogram bars that rise above the threshold.
This confirms that the downward move has sufficient momentum for a short-term trade.
- The Trend Scalp Indicator moves below its neutral level.
- Waddah Attar Explosion changes to red and begins forming larger bars.
- The red histogram moves above the explosion threshold.
- Wait for bearish price confirmation before entering.
- Place the stop loss above the latest M5 swing high.
- Manage the position toward the next support level or while bearish momentum remains strong.
Waddah Attar threshold
The important filter is the Waddah Attar threshold.
If the Trend Scalp Indicator points upward but the histogram remains below the explosion line, there is no strong momentum confirmation yet.
The same applies to SELL setups.
Waiting for the histogram to expand beyond the threshold can help avoid taking weak M5 signals during periods of low activity or sideways price movement.
This approach works particularly well when a short-term pullback is followed by renewed momentum.
For example, EURUSD may temporarily move lower while the Trend Scalp Indicator becomes negative.
If the broader M5 price movement remains bullish, wait for the Trend Scalp reading to return positive and then look for expanding green Waddah Attar bars above the threshold.
That sequence provides a more selective continuation entry than trading every histogram change on its own.
Get Instant Free Access
Indicator Settings
- Fast MACD Period: Sets the period used for the fast moving average in the internal MACD calculation.
- Slow MACD Period: Defines the period of the slower moving average used by the indicator.
- Bollinger Period: Controls the calculation period of the Bollinger Bands component.
- Sensitive: Determines how strongly the indicator reacts to price changes. Lower timeframes may require different sensitivity values than higher timeframes.
- Dead Zone in Points: Defines the height of the dead-zone area used to filter low-momentum conditions.
- Explosion Power: Sets the explosion power level at which the indicator can issue a warning.
- Strength of the Trend: Defines the trend-slope strength required for the indicator to generate a warning.
- Alert Count: Allows the warning window to be enabled or disabled according to the selected setting.
Important Notes
- A histogram crossing the threshold does not guarantee that the move will continue.
- Flat threshold conditions and small histogram bars generally provide weaker trading opportunities.
- Very low timeframes can produce frequent changes in momentum and require stricter filtering.
- Increasing histogram size is more significant when it occurs alongside a meaningful price breakout.
- Higher sensitivity can produce faster reactions but may also increase the number of short-term signals.
- Test the settings on each instrument and timeframe because volatility characteristics differ considerably between markets.









