
The VR Draw indicator for MT4 is a chart-drawing utility designed for traders who want to mark important areas directly on their MetaTrader 4 charts.
It does not generate buy or sell signals.
Its purpose is to make chart analysis more interactive by providing tools for drawing lines, curves, circles, and other visual markings.
This can be particularly useful when studying price action, mapping support and resistance, highlighting entry and exit areas, or planning a trade before execution.
It is also practical for anyone who wants to demonstrate a trading setup directly on an MT4 chart without relying on external image-editing software.
Why traders use the VR Draw Indicator
Technical analysis often involves marking swing points, breakout zones, trend boundaries, and areas where price may react.
VR Draw allows you to place these markings directly on the active chart and adjust them as the analysis progresses.
The drawing tools can also help organize a trading idea visually.
Different colors and line widths can be used to distinguish support from resistance, projected price paths from existing market levels, or important areas from secondary observations.
An eraser function allows unwanted markings to be removed when the analysis changes.
Download This MT4 Indicator for Free
Indicator Chart Setup
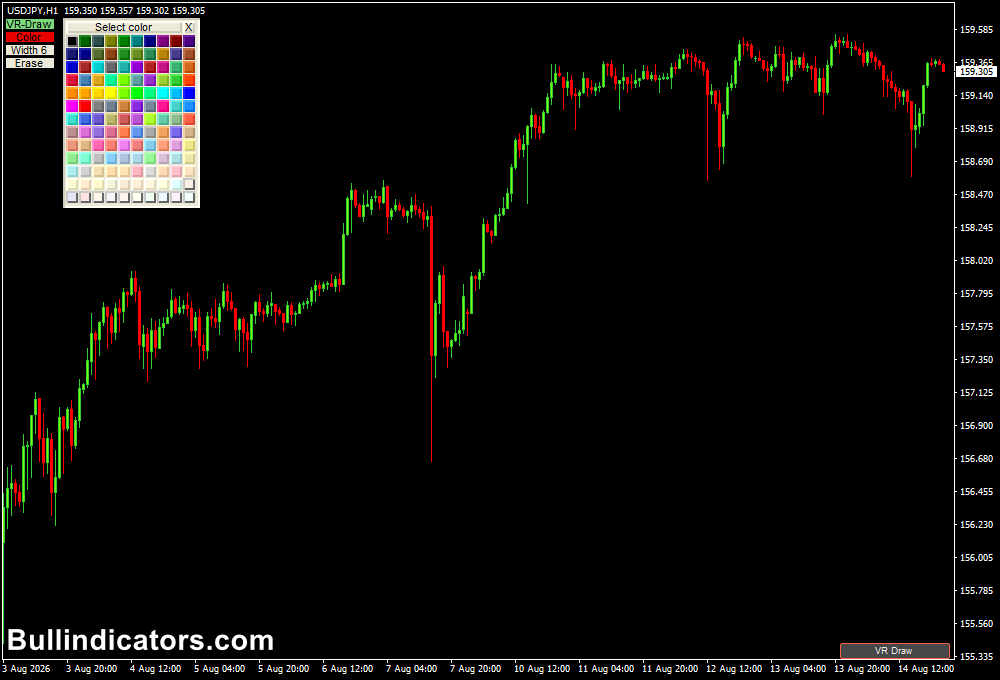
VR Draw adds drawing controls to the MT4 chart, allowing you to interact with price action and mark specific areas of interest.
The available tools can be used to create custom lines, curves, circles, and other visual references.
For example, you could mark a previous swing high with a horizontal line, outline a support zone with a different color, or draw a projected price path to visualize a possible trade.
Line width and color can be adjusted to make important annotations easier to distinguish.
Core Features
- Draws directly on MT4 price charts.
- Supports custom chart annotations and markings.
- Allows different colors for individual drawing elements.
- Provides adjustable drawing width.
- Includes an eraser for removing unwanted markings.
- Useful for technical analysis and trade planning.
Best for
- Marking support and resistance areas.
- Highlighting swing highs and swing lows.
- Planning potential entry, stop-loss, and target zones.
- Drawing projected price movements.
- Explaining trading setups directly on an MT4 chart.
Best Markets
- EURUSD for marking intraday support, resistance, and session levels.
- USDJPY when mapping swing points and projected price paths.
- GBPJPY for outlining larger price movements and reaction zones.
- XAUUSD for marking wider support and resistance areas during volatile sessions.
- US30 and NAS100 for annotating major highs, lows, and breakout areas.
Trading Styles
- Price action trading with manually marked reaction zones.
- Scalping where precise levels need to be identified quickly.
- Day trading for planning session highs, lows, and breakout areas.
- Swing trading for mapping larger market movements.
- Educational and demonstration purposes when explaining trading setups.
How traders use it
VR Draw does not determine market direction or produce automated trading signals.
The analysis comes from you, while the drawing tools help translate that analysis onto the chart.
Support and Resistance Example
- Identify a previous price reaction or significant swing point.
- Draw a horizontal line through the relevant level.
- Use a different color to distinguish support from resistance.
- Monitor how price behaves when it returns to the marked area.
- Combine the level with candlestick or momentum confirmation before considering a trade.
Trade Planning Example
- Mark the planned entry area on the chart.
- Draw a line or zone around the intended stop-loss location.
- Mark the projected take-profit area.
- Use a curve or directional drawing to illustrate the expected price path.
- Remove or adjust the markings if the market invalidates the original setup.
For example, on a USD/CAD M15 chart, you could mark a previous swing low, draw the planned long entry area, and outline a potential target above the recent high.
This creates a simple visual plan that can be monitored as price develops.
Get Instant Free Access
Indicator Settings
- Corner: Sets the chart corner where the drawing control or indicator interface is positioned.
- X Position Label: Controls the horizontal offset of the indicator button or label.
- Y Position Label: Controls the vertical offset of the indicator button or label.
- Colors: Allows drawing elements to be assigned different colors for easier chart organization.
- Width: Controls the thickness of drawing elements so important markings can be made more prominent.
Important Notes
- VR Draw does not generate automated buy or sell signals.
- The quality of the analysis depends on the levels and observations you place on the chart.
- Use the drawing tools to support a defined trading plan rather than as a substitute for market analysis.
- Different colors can help separate support, resistance, entries, targets, and projected price paths.
- Always trade with appropriate risk management and predefined invalidation levels.









