
The TRIX indicator for MT4 is a momentum oscillator designed to reduce the effect of minor price fluctuations and focus attention on more meaningful market movements.
Based on triple-smoothed exponential moving averages, it can help identify momentum shifts while filtering some of the noise that often affects shorter-term trading decisions.
The tool displays directional signals as arrows and can also be used to assess overbought and oversold conditions.
Another useful application is divergence analysis, where the oscillator moves differently from price and potentially warns that the current momentum is weakening.
Why traders use the TRIX Indicator
Fast-moving markets frequently produce short-lived fluctuations that can make momentum analysis difficult.
TRIX applies multiple layers of exponential smoothing to reduce these minor movements and provide a more stable view of momentum.
The combination of directional arrows, oscillator extremes, and divergence gives the tool several practical applications.
A signal arrow can help with entry timing, while divergence can alert you to a possible change in momentum before the price actually reverses.
TRIX can also complement moving-average systems.
Since its calculation is based on smoothed exponential averages, it can work well alongside a trend-following method that establishes the broader market direction.
Download This MT4 Indicator for Free
Indicator Chart Setup
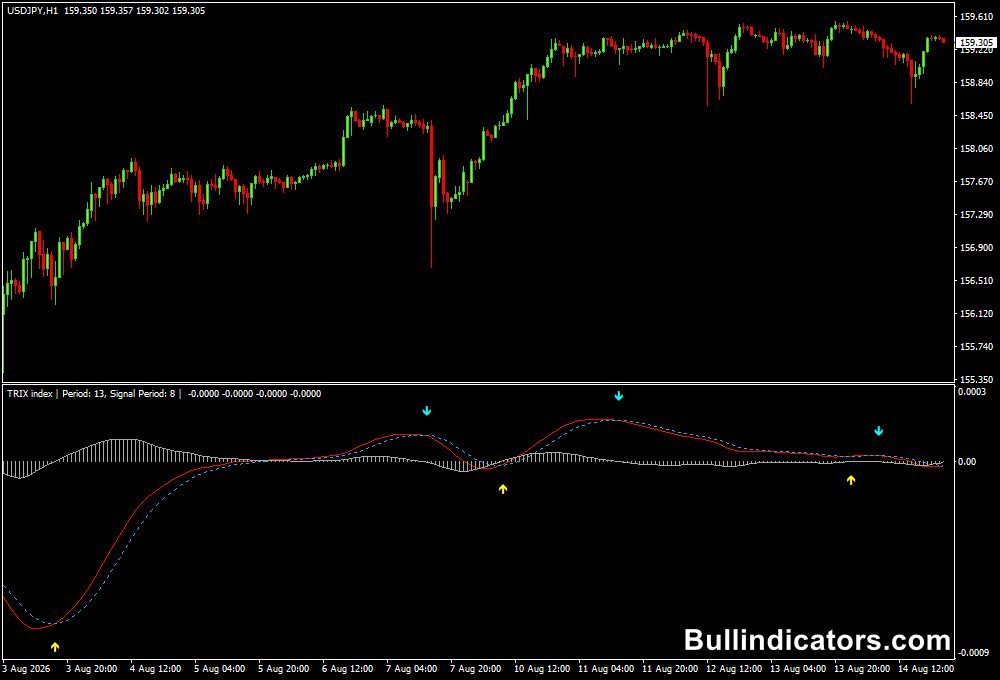
TRIX is displayed in a separate window beneath the main MT4 price chart.
The oscillator generates colored directional arrows that identify potential changes in momentum.
Yellow arrows represent buy signals, while aqua arrows represent sell signals.
The oscillator can also be monitored for extreme readings and divergence.
When price continues moving in one direction while TRIX begins moving against it, the difference can provide an early warning that the current momentum may be losing strength.
Core Features
- Uses triple-smoothed exponential moving average calculations.
- Filters a portion of minor price fluctuations.
- Provides directional buy and sell arrows.
- Supports overbought and oversold analysis.
- Can identify bullish and bearish divergence.
- Suitable for forex, indices, and other liquid markets.
Best for
- Momentum and trend-direction analysis.
- Filtering weaker short-term market movements.
- Identifying potential momentum reversals.
- Combining oscillator signals with broader trend filters.
- Spotting divergence before a possible price reversal.
Best Markets
- EURUSD for smoother intraday momentum movements.
- GBPJPY when trading stronger directional swings.
- US30 and NAS100 for momentum-driven index sessions.
- XAUUSD during London and New York periods when volatility increases.
- USDJPY for trend-following setups on M15, H1, and H4 charts.
Trading Styles
- Intraday momentum trading on M15 and H1.
- Swing trading using H4 and D1 trend movements.
- Trend-following strategies based on directional signals.
- Reversal trading using divergence confirmation.
- Index trading during high-volume market sessions.
How traders use it
The basic approach is to use the arrow signals together with the broader market direction.
A yellow arrow indicates a potential bullish signal, while an aqua arrow indicates a potential bearish signal.
Always trade in the direction of the main trend whenever possible rather than treating every arrow as an independent entry.
TRIX Buy Rules
- Confirm that the broader market is bullish.
- Wait for a yellow TRIX arrow to appear.
- Check that price action supports the bullish direction.
- Enter a buy position after the signal receives confirmation.
- Place the stop loss below a relevant recent swing low.
- Hold the position while bullish momentum remains intact.
- Consider exiting when an opposite TRIX signal appears or when the next major resistance area is reached.
TRIX Sell Rules
- Confirm that the broader market is bearish.
- Wait for an aqua TRIX arrow to appear.
- Check that price action confirms continued selling pressure.
- Enter a sell position after bearish confirmation.
- Place the stop loss above a relevant recent swing high.
- Maintain the position while bearish momentum continues.
- Consider exiting on an opposite TRIX signal or near an important support area.
Combining TRIX with Super Arrow Buy Sell
TRIX can be combined with the Super Arrow Buy Sell Indicator for MT4 to add a simple trend-direction filter.
A green arrow represents a bullish trend, while a red arrow represents a bearish trend.
Combined Buy Rules
- Wait for the Super Arrow to display a green arrow.
- Confirm that the broader market is moving upward.
- Wait for a yellow TRIX buy arrow.
- Check that price action is not immediately approaching major resistance.
- Enter long after the TRIX signal is confirmed by the bullish trend direction.
- Place the stop loss below the latest meaningful swing low.
- Take profit at a suitable resistance level, predefined target, or when bearish momentum develops.
Combined Sell Rules
- Wait for the Super Arrow to display a red arrow.
- Confirm that the broader market is declining.
- Wait for an aqua TRIX sell arrow.
- Check that price is not immediately sitting on major support.
- Enter short after the TRIX signal agrees with the bearish trend.
- Place the stop loss above the latest meaningful swing high.
- Take profit near support, at a predefined target, or when bullish momentum returns.
Get Instant Free Access
Indicator Settings
- TRIX_Period: Determines the calculation period used by the TRIX oscillator. Higher values generally produce a smoother reading, while lower values make it more responsive.
- Signal_Period: Sets the period used to calculate the TRIX signal.
- Signals: Controls the display of the directional signal arrows.
Important Notes
- Always prioritize the main market trend when evaluating TRIX signals.
- Do not treat an isolated arrow as a guaranteed entry signal.
- Divergence can warn of weakening momentum, but price may continue trending before reversing.
- Oscillators can remain overbought or oversold during strong trends.
- Lower timeframes generally produce more signals and can also contain more market noise.
- Use sensible risk management and confirm important signals with price action or another trend filter.









