
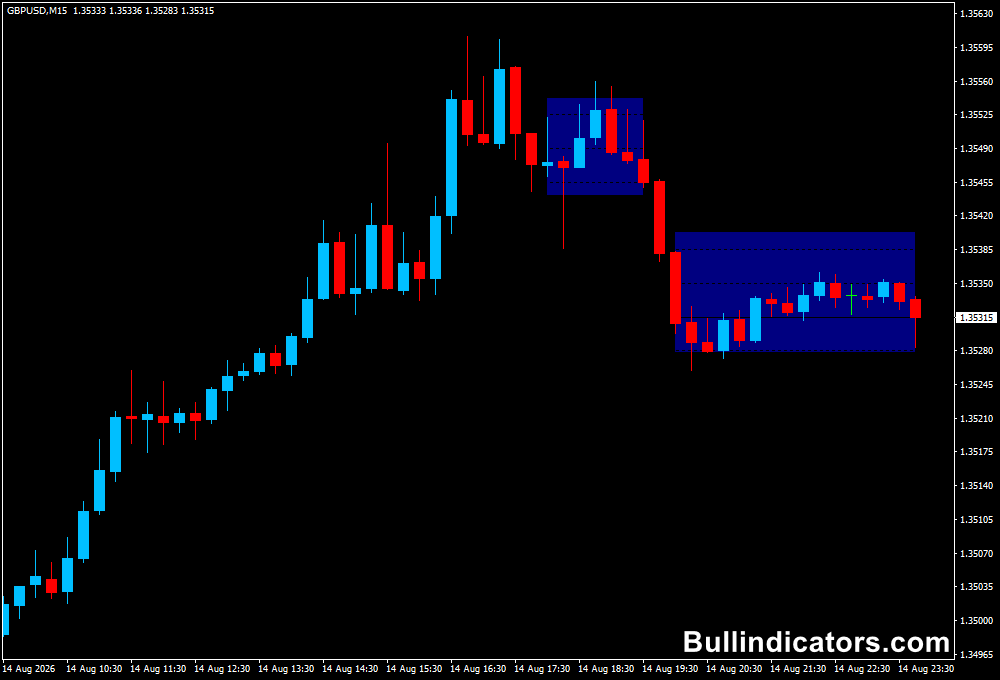
The Sideways Markets Detector indicator for MT4 automatically identifies periods when price is moving within a relatively narrow range rather than following a strong directional trend.
It highlights these conditions with a blue rectangle, showing the area where buyers and sellers are struggling to establish control.
For scalpers and intraday traders, recognizing a sideways market can be just as important as identifying a trend.
Choppy conditions often produce weak signals and false breakouts, while the eventual break from a well-defined range can create a much cleaner trading opportunity.
Why traders use the Sideways Markets Detector
Trading every market movement is rarely efficient.
When price repeatedly moves between similar highs and lows, trend-following strategies can produce several losing entries before a genuine move develops.
The Sideways Detector helps identify these periods visually so you can reduce unnecessary trades and wait for better conditions.
The highlighted range also provides two important reference points.
The upper boundary can become a potential bullish breakout level, while the lower boundary can act as a bearish trigger.
The strongest setups usually occur when the breakout agrees with the broader market direction and is confirmed by price action.
A useful combination is a moving average or other trend filter.
This allows you to focus on bullish range breaks when the larger trend is upward and bearish breaks when the broader market is declining.
Download This MT4 Indicator for Free
Indicator Chart Setup
The detector marks a sideways trading area with a blue rectangle.
The box represents the range within which price has been moving and provides clear upper and lower boundaries to monitor.
Once price leaves the highlighted area, you can evaluate whether the move represents a genuine breakout or a temporary spike.
Waiting for a candle close beyond the range can help reduce the number of false entries.
Core Features
- Automatically detects sideways and neutral market conditions.
- Highlights ranging areas with a blue rectangle.
- Provides clear upper and lower breakout reference points.
- Helps identify periods where trend trading may be less effective.
- Can be used across multiple MT4 timeframes.
- Useful for breakout and range-analysis strategies.
Best for
- Identifying choppy conditions before committing to a trade.
- Finding consolidation ranges that may precede a breakout.
- Planning entries around the top and bottom of a range.
- Filtering out low-quality trend signals.
- Combining range analysis with a broader trend filter.
Best Markets
- EURUSD for session ranges that form before major market openings.
- USDJPY during quieter Asian periods before European liquidity arrives.
- GBPUSD when price consolidates ahead of London or New York activity.
- US30 and NAS100 during periods of compressed movement before a session breakout.
- XAUUSD when volatility contracts before a stronger directional expansion.
- Any other volatile currency pair.
Trading Styles
- Scalping around well-defined range boundaries.
- Intraday breakout trading on M15 and H1.
- London-session range breakout strategies.
- Volatility expansion setups after consolidation.
- Swing breakout analysis on H4 and D1.
How traders use it
The primary goal is to avoid forcing trades while the market remains trapped inside the highlighted box.
Once price approaches either boundary, shift attention toward the possibility of a breakout and wait for confirmation before entering.
Buy Setup
- Identify a blue sideways-market rectangle.
- Determine the broader market direction using a moving average or another trend tool.
- Prefer bullish breakouts when the main trend is already upward.
- Wait for price to break above the upper boundary.
- Allow the breakout candle to close above the range.
- Look for continued buying pressure or a successful retest of the broken boundary.
- Enter a buy after the bullish breakout is confirmed.
- Place the stop loss below the breakout structure or inside the previous range.
- Target the next resistance level or use a predefined risk-to-reward objective.
Sell Setup
- Identify the highlighted sideways range.
- Confirm that the broader trend favors the downside.
- Wait for price to break below the lower boundary.
- Require a bearish candle to close below the range.
- Look for follow-through or a failed retest of the broken support.
- Enter a sell after bearish confirmation.
- Place the stop above the breakout structure or within the former range.
- Target the next support level or a predefined risk-to-reward objective.
False Breakout Filter
One of the main risks with range trading is a temporary move beyond the rectangle followed by an immediate return inside it.
Avoid treating a brief wick outside the box as a confirmed breakout.
A stronger setup develops when price closes beyond the boundary and continues moving in the same direction.
For example, if EURUSD breaks above a range but the next candle closes back inside the rectangle, the breakout has not demonstrated enough follow-through.
Waiting for renewed bullish momentum can prevent entering a weak setup.
Get Instant Free Access
Indicator Settings
- Min Zone Width: Determines the minimum number of candles required before a sideways market zone is identified.
- Tolerance: Controls the maximum permitted price range or tolerance used when determining whether the market remains sideways.
- Rectangle Color: Sets the color used for the highlighted consolidation area.
Important Notes
- The indicator identifies ranging conditions but does not predict which direction the eventual breakout will take.
- Always use a trend filter when possible, particularly when trading breakout continuation setups.
- Wait for a candle close outside the range before considering the move confirmed.
- False breakouts can occur, especially during low-volume periods.
- M15 to H1 charts are particularly useful for intraday breakout analysis, while H4 and D1 can be used for broader consolidation zones.
- Do not force trades while price remains inside a clearly defined sideways range unless your strategy specifically targets range reversals.
- Use appropriate stop-loss placement and risk management for every breakout trade.









