
The FX5 MACD Divergence V1_1 indicator for MT4 is designed to identify bullish and bearish divergence directly on the price chart.
It compares price movement with MACD behavior to locate situations where momentum may be weakening or shifting direction.
The tool recognizes both regular and reverse divergence and marks these formations with trend lines and directional arrows.
For short-term setups, the signals can also be used as a timing tool around key support and resistance areas.
Higher timeframes can help establish the broader market bias, while lower charts can be used to fine-tune an entry.
Why traders use the FX5 MACD Divergence V1_1 Indicator
Divergence can be difficult to spot consistently because price and momentum do not always move in sync.
FX5 MACD Divergence automates this scanning process and highlights potential reversal conditions as they develop.
Regular divergence can point toward a possible change in the prevailing direction, while reverse divergence can help identify continuation opportunities.
The combination of divergence lines, MACD information and BUY/SELL arrows gives technical traders several elements to evaluate before entering a position.
Download This MT4 Indicator for Free
Indicator Chart Setup
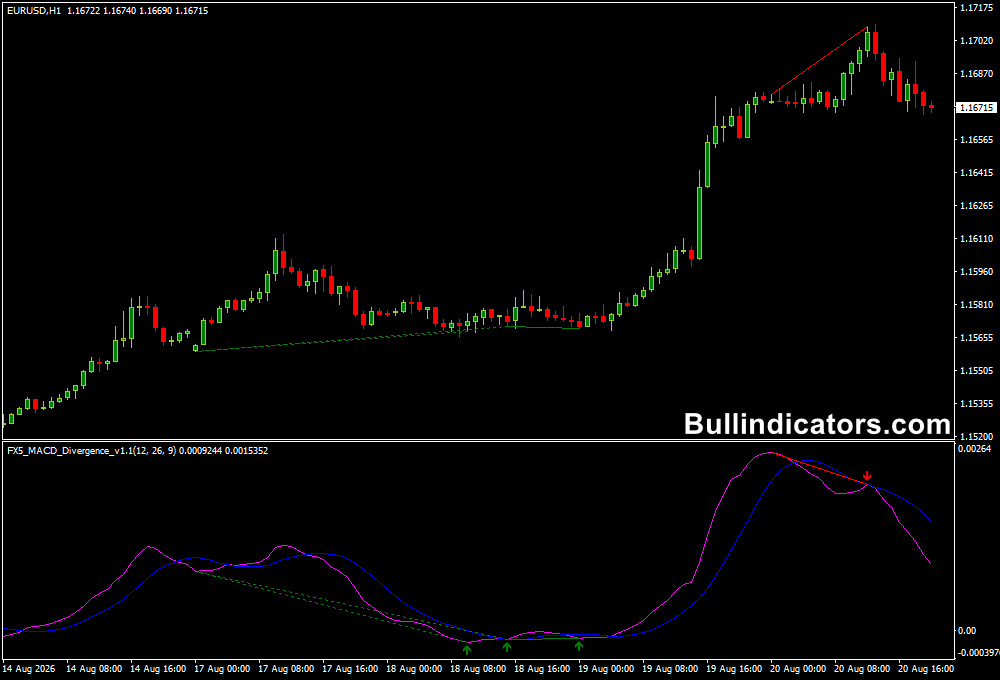
The FX5 MACD Divergence V1_1 displays MACD information in a separate indicator window while marking detected divergence directly against price.
Regular divergence is represented with solid trend lines, while reverse divergence uses dotted lines.
Bullish formations are marked in green and bearish formations in red. BUY and SELL arrows can also appear on the chart, giving a quick reference point for further analysis.
The signals are delayed by one candle to reduce repainting and provide a more filtered indication.
Core Features
- Detects regular bullish and bearish divergence.
- Identifies reverse bullish and bearish divergence.
- Plots divergence trend lines on the chart.
- Provides BUY and SELL arrow signals.
- Includes configurable MACD parameters.
- Supports multiple timeframes and currency pairs.
- Designed to reduce repainting through one-candle signal confirmation.
Best for
- Spotting potential momentum reversals.
- Finding continuation setups through reverse divergence.
- Confirming entries around established support and resistance.
- Filtering short-term reversal setups.
- Combining divergence analysis with price action.
Best Markets
- EURUSD and GBPUSD for liquid intraday setups.
- EURJPY and GBPJPY for stronger price swings and divergence formations.
- Gold (XAUUSD) for momentum-based reversal analysis.
- Major indices such as US30 and NAS100 when volatility is elevated.
Trading Styles
- Scalping on M1, M5 and M15 charts.
- Intraday trading using M15 and H1 confirmation.
- Swing trading with H4 and D1 divergence signals.
- Reversal trading around major support and resistance zones.
- Momentum continuation strategies using reverse divergence.
How traders use it
A common approach is to first establish the market direction on H1 or H4, then look for a corresponding divergence setup on M5 or M15.
For example, during a short-term bullish setup, price may form a lower low while MACD creates a higher low.
This regular bullish divergence can signal weakening selling pressure.
Scalping Example
For scalping, a trader could use the M5 chart on EURUSD and look for bullish divergence near a previously established support zone.
Once the bullish arrow appears and price confirms the reaction, the position could target approximately 10–15 pips, with the stop placed beyond the recent swing low.
A bearish setup can be handled oppositely, particularly when divergence forms near resistance.
The arrow should not be treated as an automatic entry.
Price action, market conditions and nearby support or resistance remain important when deciding whether the setup offers enough room for a trade.
Get Instant Free Access
Indicator Settings
- fastEma: Sets the Fast EMA period used in the MACD calculation.
- slowEma: Defines the Slow EMA period for the MACD calculation.
- signalSMA: Controls the Signal SMA period.
- drawIndicatorTrendlines: Enables or disables trend lines drawn within the MACD indicator window.
Important Notes
- Divergence can precede a reversal, but it does not guarantee that price will change direction.
- The one-candle delay is designed to reduce repainting and provide more reliable confirmed signals.
- Higher timeframes generally produce fewer but more significant divergence formations.
- For scalping, combine M5 signals with nearby market levels and avoid entries when the available price range is too small.
- Risk management should determine position size and stop placement for every setup.









