
Price Patterns indicator for MT4 is designed to automatically scan the market for recognizable price formations that can provide information about potential reversals and continuation moves.
It identifies formations such as head and shoulders, double tops, double bottoms, triangles, and rising or falling wedges directly on the chart.
This can save considerable time when analyzing multiple currency pairs.
Rather than manually searching hundreds of candles for a possible formation, the tool highlights developing and completed patterns so you can concentrate on confirmation, entries, stop loss placement, and profit targets.
Why traders use the Price Patterns Indicator
Price formations often reflect changes in buying and selling pressure.
A double bottom near support can signal that sellers are losing control, while a head and shoulders formation may warn of a bearish reversal.
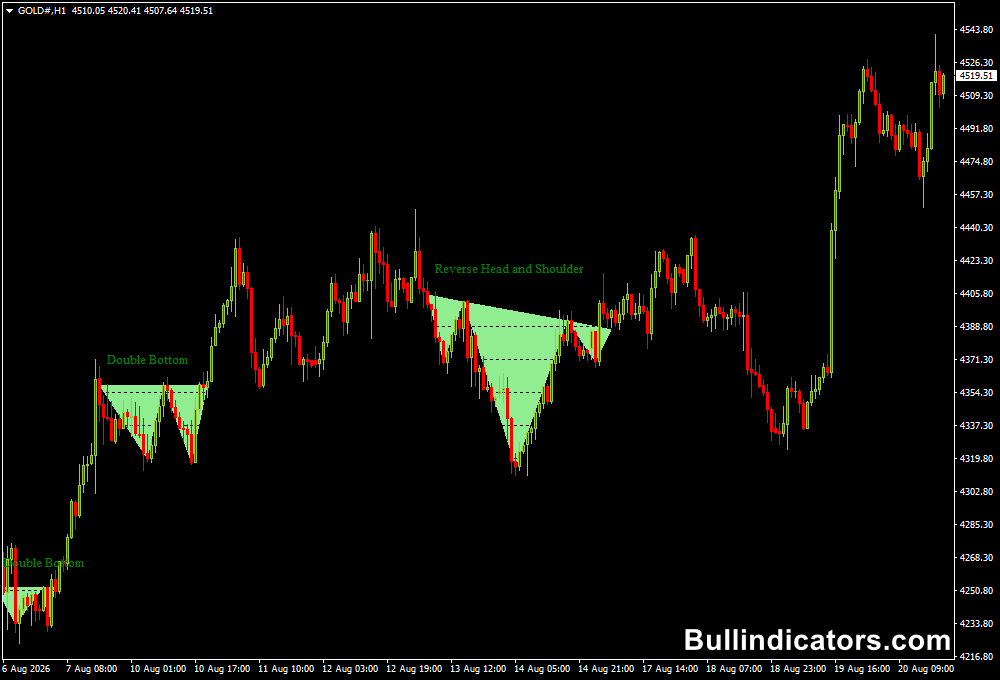
The Price Patterns Indicator makes these formations easier to recognize by shading and labeling the relevant areas.
This is particularly useful for traders who base decisions on price action and want to monitor several instruments at the same time.
Higher timeframes such as H4, D1, and W1 are especially useful because formations generally have more significance when they develop over a larger number of candles.
Download This MT4 Indicator for Free
Indicator Chart Setup
Once running on a MetaTrader 4 chart, the tool scans historical and current price data for supported formations.
Detected patterns are displayed directly over the candles, with separate colors for bullish, bearish, and still-forming formations.
For example, a triple or double bottom around an established support area can draw attention to a possible long setup.
A head and shoulders pattern near resistance can highlight a potential short opportunity.
A triangle or wedge can help identify a possible continuation or breakout scenario.
The pattern itself should be treated as a trading signal generator rather than an automatic entry.
Support, resistance, momentum, and the candle close should also be considered before taking a position.
Core Features
- Automatically searches the chart for multiple price formations.
- Identifies head and shoulders and double top/bottom patterns.
- Detects triangle, rising wedge, and falling wedge formations.
- Uses different colors for bullish, bearish, and developing patterns.
- Allows the historical search range to be adjusted.
- Supports popup, email, and push notifications.
Best for
- Finding potential reversal areas around support and resistance.
- Spotting continuation formations during established trends.
- Monitoring several currency pairs without manually searching every chart.
- Higher-timeframe price action analysis on H4 and D1.
- Combining chart formations with breakout and confirmation strategies.
Best Markets
- EURUSD and GBPUSD for major-pair trend formations.
- USDJPY and USDCHF for structured H4 and daily setups.
- GBPJPY for larger formations and stronger directional movements.
- Gold (XAUUSD) can also be monitored when clear formations develop around major levels.
Trading Styles
- Intraday trading using H1 and H4 formations.
- Swing trading with D1 and W1 patterns.
- Breakout trading around triangle and wedge formations.
- Reversal trading using double tops, double bottoms, and head and shoulders.
How traders use it
A practical way to use the tool for day trading is to begin with H1 or H4 charts and search for a completed formation close to an important market level.
Confirmation is important. For a bullish setup, price should preferably hold support and close convincingly above the relevant trigger area.
For a bearish setup, look for rejection from resistance and a close below the neckline or breakout level.
Day trading tips
For a 30-pip daily objective, typically for day traders, focus on one or two high-quality setups rather than trying to capture every pattern.
For example, a bullish double bottom followed by a neckline breakout could provide an entry with a 30-pip target, provided the market has enough volatility to support that distance.
On a bearish head and shoulders setup, the entry can be considered after a confirmed neckline break, with the stop positioned above an appropriate swing point.
A 30-pip target is not guaranteed every day, so the objective should be treated as a trading framework rather than a promise of fixed daily returns.
Risk should remain controlled, particularly when several formations appear at the same time.
Get Instant Free Access
Indicator Settings
- Display head and shoulder – Shows or hides head and shoulders formations.
- Display double top pattern – Enables double-top detection.
- Display double bottom pattern – Enables double-bottom detection.
- Display triangle pattern – Displays detected triangle formations.
- Display rising wedge pattern – Enables rising-wedge detection.
- Display falling wedge pattern – Enables falling-wedge detection.
- Maximum number of bars for patterns search – Controls how many historical candles are scanned, with 1000 bars as the default.
- Bull pattern color – Selects the color used for bullish formations.
- Bear pattern color – Selects the color used for bearish formations.
- Forming pattern color – Defines the appearance of formations still developing.
- Popups alerts – Enables popup notifications.
- Email alerts – Enables email notifications.
- Push alerts – Enables mobile push notifications.
Important Notes
- Wait for a pattern to develop and confirm before entering a position.
- Higher-timeframe formations generally deserve more attention than very short-term patterns.
- Use support, resistance, trend direction, and candle confirmation alongside the detected formation.
- Set the stop loss around a logical swing high or swing low rather than using an arbitrary distance.
- A 30-pip target can be used as a daily objective, but market conditions determine whether that target is realistically available.
- Test the formations on a demo account before incorporating them into a live trading strategy.









