
The SSL indicator for MT4 is a momentum-based trend-following tool designed to show when market direction shifts from bullish to bearish and vice versa.
Its main feature is a colored line that moves in relation to price, providing a straightforward way to assess the prevailing direction and potential trend changes.
The line reacts to changes in momentum, making the SSL Indicator particularly useful for short-term trading.
It can be used on fast M1 and M5 charts for scalping, while higher periods such as H1, H4 and D1 offer a broader view of the market trend.
Why traders use the SSL Indicator
The simplicity of the SSL Indicator is one of its main strengths.
Rather than relying on multiple chart elements, the position of one line provides the primary directional information.
When the line remains below price, the market is considered bullish. When it moves above price, the bias becomes bearish.
This makes the tool useful for both trend identification and trade management.
A trader can look for a buy when price is supported by a bullish SSL reading and consider exiting when the line crosses to the opposite side.
The same principle applies to short positions.
Another important feature is that the signal does not repaint after the candle has closed.
For this reason, entries should be evaluated using confirmed candle closes rather than reacting to an unfinished candle that may still change direction.
Download This MT4 Indicator for Free
Indicator Chart Setup
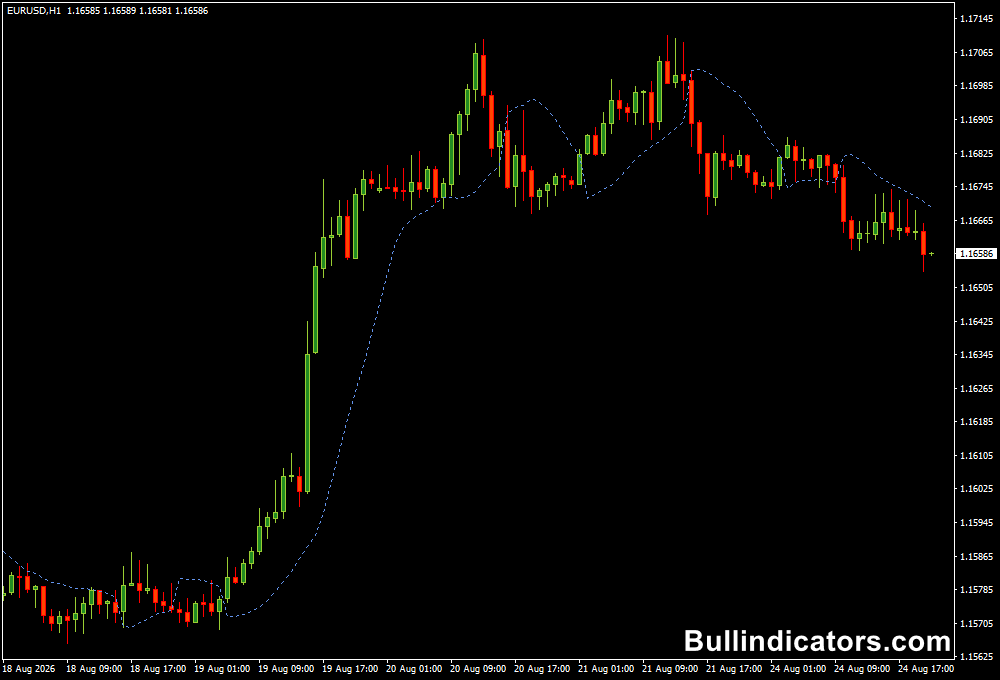
The SSL line is displayed directly around the price candles and changes position as market momentum develops.
A line below price indicates bullish conditions, while a line above price points toward bearish conditions.
For example, on GBP/USD H4, a move that places the SSL line below price can indicate that buyers have gained control.
If the following candle closes while the line remains below the market, the bullish reading is confirmed.
A later crossover above price can warn that the existing trend is losing direction.
Core Features
- Identifies bullish and bearish market conditions.
- Uses a momentum-based trend line.
- Reactively tracks changes in price direction.
- Provides potential entry and exit signals.
- Does not repaint after a candle has closed.
- Works across short, medium and higher timeframes.
Best for
- Following established market trends.
- Identifying potential trend changes.
- Timing entries after a confirmed candle close.
- Managing exits during directional moves.
- Filtering short-term trades according to the broader market bias.
Best Markets
- GBP/USD for liquid London-session trend setups.
- USD/JPY when sustained directional movement develops.
- AUD/USD for smoother trend-following conditions.
- EUR/JPY for more active intraday opportunities.
- Gold (XAU/USD) when strong momentum creates extended directional moves.
Trading Styles
- Scalping on M1, M5 and M15.
- Intraday trading on M15, M30 and H1.
- Swing trading with H4 and D1 trend confirmation.
- Trend-following strategies on higher timeframes.
How traders use it
The basic method is to wait for the SSL line to move across price and then allow the candle to close before acting.
When the line settles below price, the focus shifts toward long setups.
When it moves above price, short opportunities become more relevant.
Buy and sell setup explained
For a buy setup, the previous swing low can provide a logical area for stop-loss placement.
For a sell setup, the previous swing high can serve as the reference point. This keeps the risk level connected to recent market structure rather than using an arbitrary distance.
Example
For example, consider USD/JPY on M5 during the New York session.
If price moves above the SSL line and the candle closes with the line remaining below price, a scalper may consider a long entry.
If the market continues higher, the position can be managed while the SSL remains bullish. A crossover above price can then be used as an exit warning.
On the other side, suppose AUD/USD on M15 is trending lower and the SSL line moves above price.
A confirmed bearish close can provide a potential short setup, with the recent swing high serving as the initial risk reference.
Get Instant Free Access
Indicator Settings
- Lb: Controls the calculation value used to determine the SSL output and influences how the line responds to price movement.
Important Notes
- Wait for the candle to close before treating an SSL crossover as a confirmed signal.
- A line below price indicates bullish conditions, while a line above price indicates bearish conditions.
- Stop-loss placement can be based on the previous swing low for buys or swing high for sells.
- Sideways markets can produce frequent changes in direction, so additional confirmation may be useful.
- The SSL reading is best combined with price action, support and resistance, or another trend filter when building a complete trading system.









