
The Spearman Correlation indicator for MT4 is designed to identify potential price reversals by measuring correlation and momentum around extreme market conditions.
It combines two oscillating lines with colored price bars and directional arrows, giving a practical way to assess whether a market is approaching a turning point.
The setup becomes particularly useful when reversal signals are filtered through the dominant trend.
A bullish higher-timeframe environment can be used to focus on long opportunities, while bearish conditions can help filter for short positions.
Why traders use the Spearman Correlation Indicator
One of its main strengths is its responsiveness.
The two correlation lines move through overbought and oversold areas, helping identify situations where momentum may be stretched.
Additional colored arrows and price bars provide another layer of confirmation for potential entries.
The combination makes the tool suitable for short-term setups as well as broader swing trades.
It can also be paired with a higher-timeframe trend tool to avoid taking reversal signals against the main market direction.
Download This MT4 Indicator for Free
Indicator Chart Setup
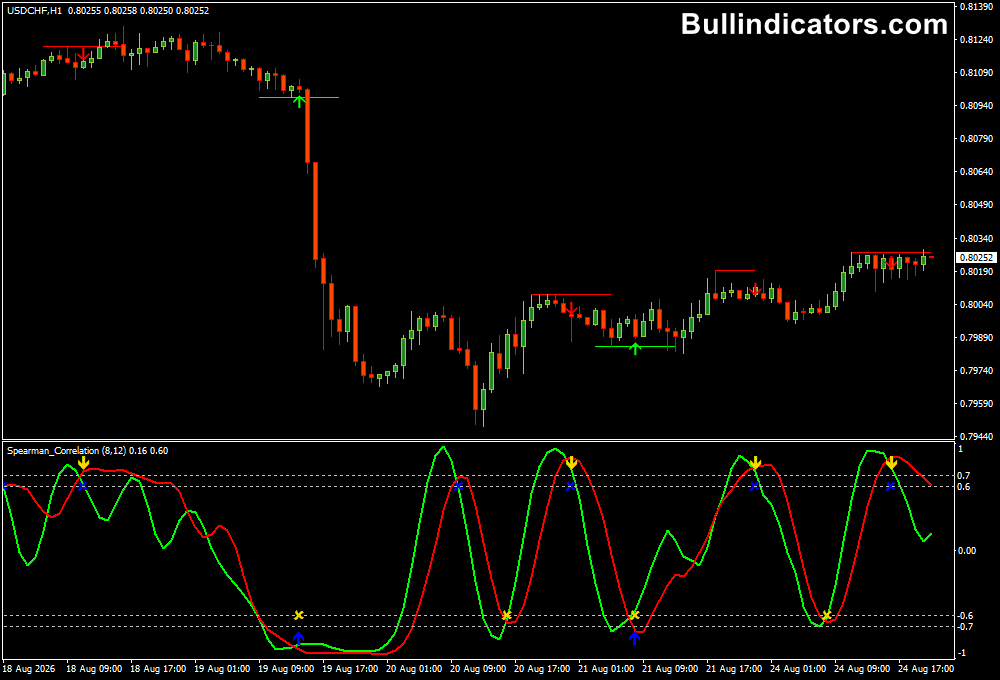
The Spearman Correlation indicator displays its calculation in a separate MT4 window beneath the main price chart.
Two lines move between defined extreme zones, while colored price bars and arrows highlight possible changes in direction.
Blue and golden arrows can signal potential bullish and bearish reversal conditions, respectively.
Lime and red arrows provide the more direct buy and sell indications.
The dotted levels mark the overbought and oversold areas where traders can begin looking for a reversal setup.
Core Features
- Two-line Spearman correlation calculation.
- Overbought and oversold reference levels.
- Colored price bars for directional confirmation.
- Blue and golden reversal arrows.
- Lime buy and red sell arrows.
- Adjustable fast and slow calculation periods.
- Suitable for multiple MT4 timeframes.
- Alert and color configuration options.
Best for
- Identifying reversal opportunities around market extremes.
- Filtering entries with overbought and oversold conditions.
- Confirming momentum shifts during established trends.
- Short-term pullback entries in trending markets.
- Combining lower-timeframe signals with higher-timeframe direction.
Best Markets
- EUR/USD and USD/JPY for liquid intraday setups.
- GBP/JPY when stronger price swings create pronounced momentum cycles.
- AUD/USD for cleaner trend-following reversal setups.
- Gold (XAU/USD) when volatility creates pronounced overbought and oversold conditions.
- Major stock indices can also be explored when the platform provides reliable price data.
Trading Styles
- Scalping on M1, M5 and M15 charts.
- Day trading on M15, M30 and H1.
- Intraday trend pullbacks using H1 confirmation.
- Swing trading with H4 and D1 market direction.
How traders use it
A practical approach is to first establish the dominant trend and then use the Spearman Correlation signals to time entries.
- In a bullish market, attention can be restricted to oversold conditions followed by a bullish signal.
- In a bearish market, overbought readings followed by a bearish signal become more relevant.
Example with the Vortex Indicator (MT4)
A Forex trader could use the Vortex Indicator for MT4 on a higher timeframe to establish the main market direction.
- If the V+ line is above the V- line, the broader bias is bullish.
- Move to a lower timeframe and wait for the Spearman lines to reach the oversold zone.
- Look for the two lines to cross upward together with a blue or lime signal.
- A buy entry can then be considered in the direction of the higher-timeframe trend.
This approach helps filter out reversal signals that go against the dominant market direction.
The same method can be applied in a bearish market:
- If the V- line is above the V+ line, the higher-timeframe bias is bearish.
- On the lower timeframe, wait for the Spearman lines to reach the overbought zone.
- Look for a downside crossover accompanied by a golden or red bearish signal.
- A sell entry can then be considered while the higher-timeframe trend remains bearish.
Get Instant Free Access
Indicator Settings
- Pearson_Spearman_Correlation: Enables or disables the rank correlation calculation.
- PCPeriod_fast: Controls the faster correlation calculation and signal responsiveness.
- PCPeriod_slow: Controls the slower correlation calculation.
- SmPeriod_fast: Adjusts the fast smoothing period.
- SmPeriod_slow: Adjusts the slow smoothing period.
- PCPrice: Sets the prior close price value used by the calculation.
- Level: Defines the internal reference level.
- Level_Ex: Defines the external reference level.
- nb: Controls the number of mismatched cases used in the calculation.
- Alerts: Controls available signal alerts.
- Colors: Allows the displayed elements to be customized.
Important Notes
- Reversal signals should be evaluated in the context of the broader market trend.
- A higher-timeframe trend filter can reduce signals that occur against strong directional momentum.
- During sideways markets, extreme readings can remain active for longer than expected.
- For scalping, M5 and M15 can provide a useful balance between signal frequency and market noise.
- For swing setups, H4 or D1 trend confirmation can provide a stronger directional filter.
- Stop-loss placement should be based on recent swing points, support, resistance or another logical risk level.









