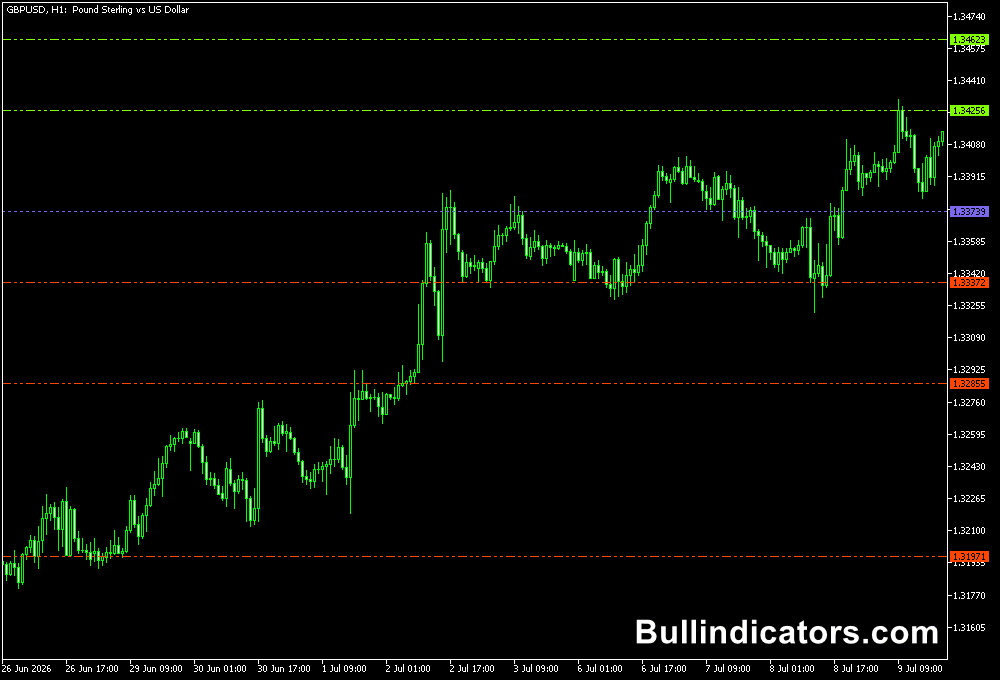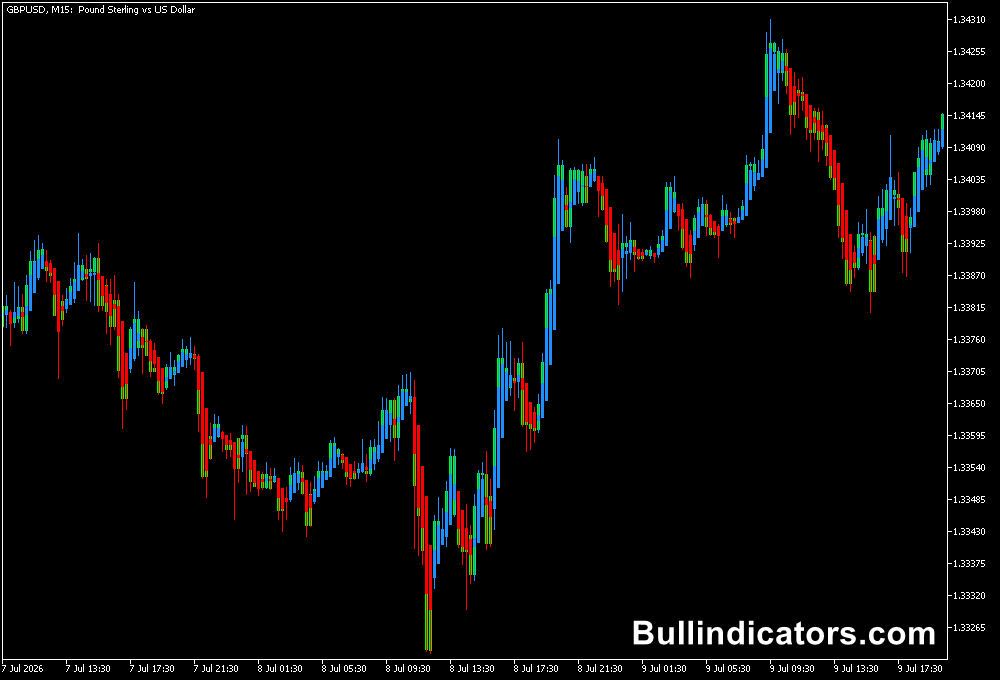
The Fair Value Gap indicator for MT5 identifies price imbalances created by strong directional movements.
Based on concepts widely used in ICT and smart money trading, it highlights areas where price may have moved rapidly, leaving an imbalance between consecutive candles.
These zones can become relevant when the market retraces, offering potential locations to study reactions, continuation setups, or changes in short-term momentum.
The indicator marks bullish and bearish fair value gaps directly on the chart and tracks how much of each zone has been covered by subsequent price action.
Adjustable detection filters help focus on larger imbalances, while extended drawing areas make it easier to monitor potential retests.
This makes FairValueGap.ex5 a practical tool for intraday analysis, particularly on EURUSD and GBPUSD during the London and US trading sessions.
Why traders use the Fair Value Gap Indicator
Fair value gaps provide a visual reference for analysing the relationship between impulsive price movements and subsequent retracements.
A bullish gap may become an area of interest when price pulls back during an uptrend, while a bearish gap can help identify potential resistance during a decline.
The coverage information adds another layer of context.
An untouched zone can highlight an unfilled imbalance, while a partially or fully covered area shows how price has interacted with it.
These details help traders compare potential entry locations with market direction, nearby support and resistance, and recent swing highs or lows.
Download This MT5 Indicator for Free
Indicator Chart Setup
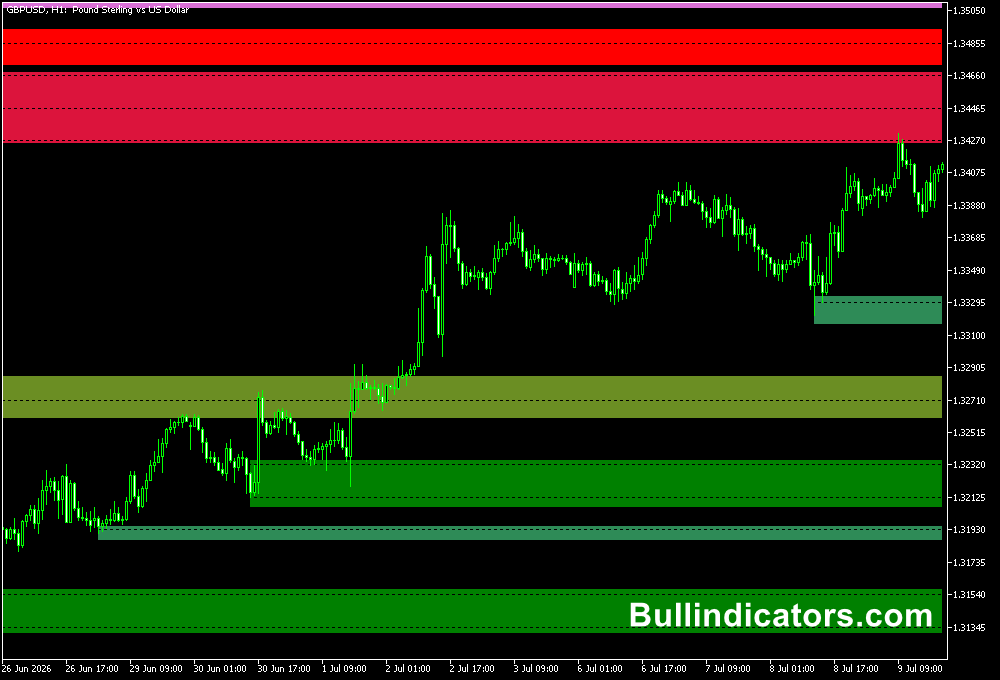
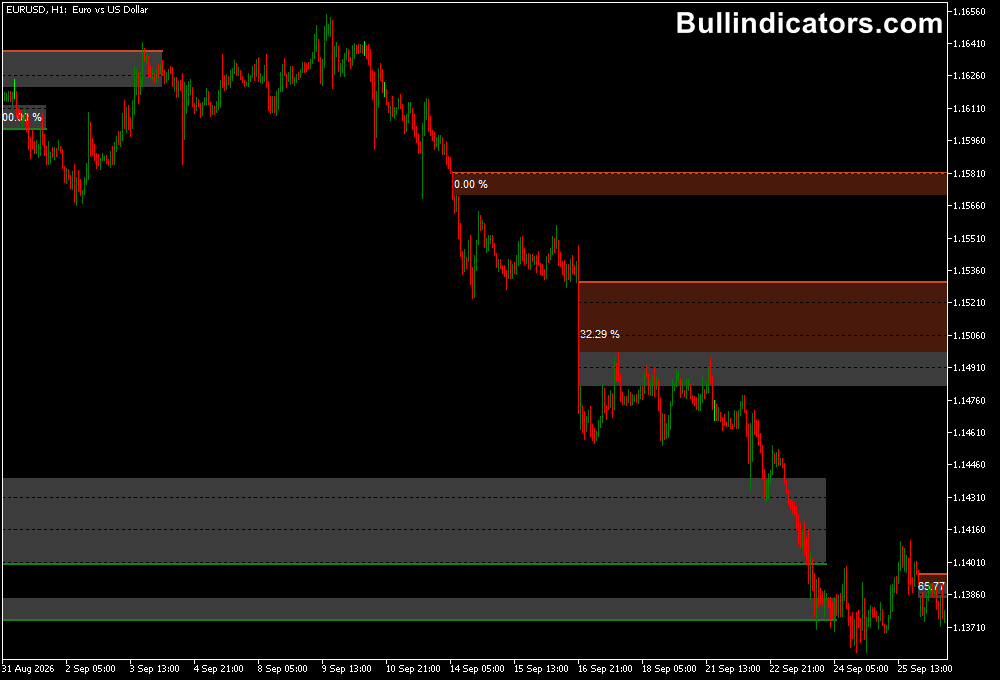
Once displayed on a chart, the indicator draws coloured zones representing bullish and bearish fair value gaps.
The zones extend across the chart according to the selected drawing settings, making potential retest areas easier to monitor.
Depending on the configuration, covered zones remain visible and display a percentage indicating how much of the original imbalance has been filled.
A bullish zone can be monitored during a pullback in an upward market, while a bearish zone may be relevant when price retraces in a downtrend.
The indicator identifies these areas automatically, allowing the analysis to focus on price behaviour around each zone.
Core Features
- Automatic detection of bullish and bearish fair value gaps.
- Adjustable historical lookback for identifying imbalances.
- Minimum gap-size filters based on candle size and average candle range.
- Visual tracking of partially and fully covered zones.
- Percentage-based coverage information for assessing mitigation.
- Adjustable drawing extension to monitor potential future retests.
Best for
- Identifying potential retracement zones following strong directional moves.
- Studying price reactions around unfilled and partially mitigated imbalances.
- Combining fair value gaps with market structure, support and resistance, or liquidity sweeps.
- Locating areas of interest for potential entries with predefined stop-loss and take-profit levels.
Best Markets
- EURUSD: A primary choice for intraday analysis because of its high liquidity during the London and US sessions.
- GBPUSD: Useful for studying sharp price movements and pullbacks during the European and American trading hours.
- USDJPY: Suitable for examining imbalances around active sessions and directional moves.
- Gold (XAUUSD): Worth testing for retracement setups after strong impulses, with attention to volatility and spread.
Trading Styles
- Scalping: Use M1 and M5 charts on EURUSD and GBPUSD during the London and US sessions to monitor short-term imbalances and potential retests.
- Intraday trading: Apply M5 and M15 charts to identify zones that align with the session trend and nearby market structure.
- Trend-following: Use M15 and H1 charts to look for pullbacks into gaps that agree with the prevailing direction.
- Multi-timeframe analysis: Identify larger imbalances on H1 and refine potential entries on M5 or M15.
How traders use it
For scalping EURUSD or GBPUSD, begin by assessing the short-term direction during the London or US session.
Look for a strong impulsive move that creates a bullish or bearish gap, then monitor whether price returns to the marked zone.
A bullish gap may be relevant in an upward market, while a bearish gap may offer an area to investigate during a decline.
Before considering an entry, check the reaction within the zone and look for supporting evidence, such as a change in short-term market structure, a rejection candle, or a liquidity sweep.
Coverage percentages help distinguish untouched gaps from areas that price has already revisited.
A gap alone does not confirm a reversal or continuation, so use a defined stop-loss and assess the available reward relative to the risk.
Get Instant Free Access
Indicator Settings
- Bars to Calculate FVG: Sets how many historical bars are analysed for fair value gaps. A higher value includes more historical price action.
- FVG > % of Analyzed Candle: Defines the minimum gap size relative to the analysed candle, helping filter smaller imbalances.
- FVG > % of Avg. Candle: Sets a minimum gap-size threshold relative to the average candle size.
- Show Covered Areas: Enables the display of gaps that have been filled or mitigated.
- Show Percentage of Coverage: Displays the proportion of each fair value gap covered by subsequent price action.
- Display Covered FVG’s: Keeps previously filled zones visible for historical reference.
- Font Size: Adjusts the size of the coverage percentage displayed on the chart.
- Extend the Drawing Area by (in bars): Sets how far the marked zones extend to the right.
Important Notes
- Fair value gaps identify potential areas of interest, not guaranteed entry signals.
- For EURUSD and GBPUSD scalping, test the settings on M1 and M5 charts during the London and US sessions.
- Major economic releases can cause rapid price movements, wider spreads, and slippage, so account for event risk.
- Combine gap analysis with market structure and price confirmation rather than entering automatically when a zone is touched.
- Test different gap-size filters on historical data and in a demo account before using the indicator with real funds.