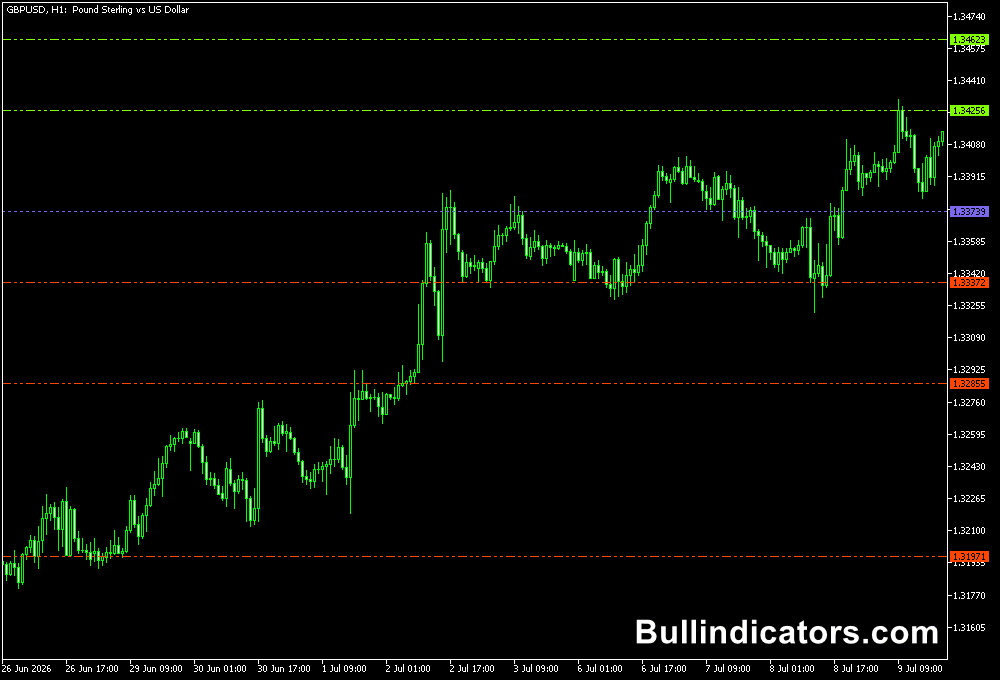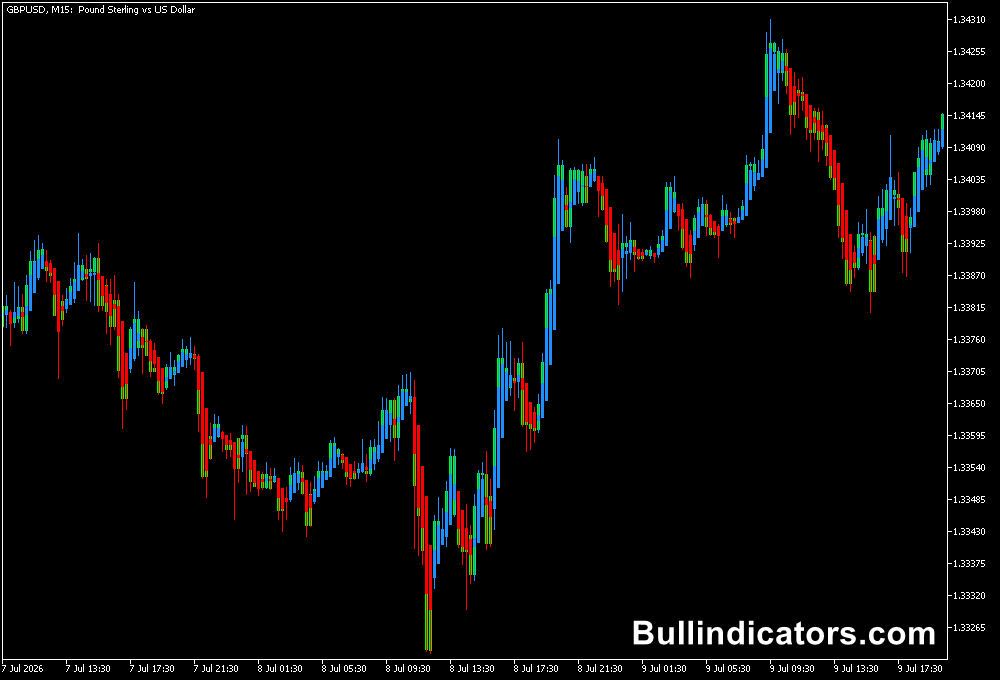
The Daily Pivot Points indicator for MT5 automatically calculates daily pivot levels and displays three support levels and three resistance levels directly on the chart.
It also plots intermediate lines between consecutive support and resistance levels, providing additional price references for analysing market direction, potential reversals, and intraday trading opportunities.
Pivot points are widely used in technical analysis because they provide predefined price levels based on previous market data.
This indicator uses daily open, high, low, and close values for its calculations, while displaying the resulting levels across different chart timeframes.
This makes it useful for analysing intraday price movements without manually calculating support and resistance.
Why Traders Use the Daily Pivot Points Indicator for MT5
Daily pivot levels help identify areas where price may encounter buying or selling pressure.
When the market trades above the central pivot, bullish conditions may be developing.
Trading below this level can indicate bearish pressure, particularly when price also breaks through a support level.
The additional intermediate lines provide more reference points between the main levels.
These can help with entry planning, profit targets, and stop-loss placement.
The indicator also includes chart information and daily candle display options, allowing users to adapt the presentation to their analysis preferences.
Download This MT5 Indicator for Free
Indicator Chart Setup
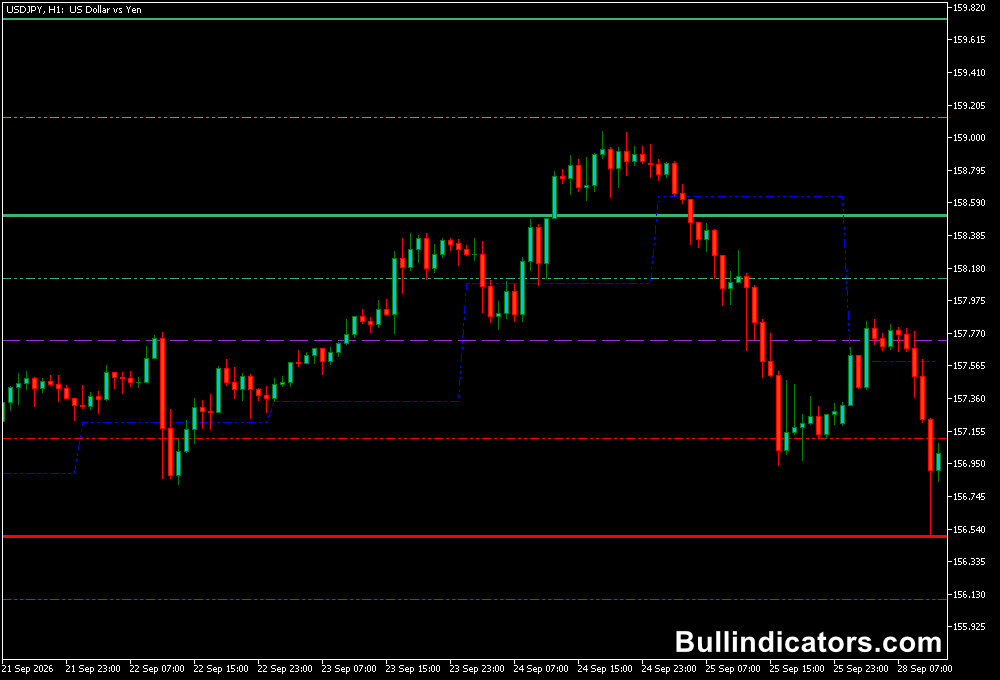
The Daily Pivot Points indicator displays a central pivot level, three support levels, three resistance levels, and dotted intermediate lines.
The original colour scheme uses blue for the central pivot, green for support, and red for resistance, although the available colour settings may allow adjustments to the display.
These horizontal levels provide a consistent framework for monitoring price action throughout the trading day.
As price approaches a resistance level, the area can be watched for a breakout or rejection.
Support levels serve a similar purpose during downward movements.
The indicator can be used on M5, M15, M30, H1, and higher timeframes.
Its calculations are based on daily price data, so changing the chart timeframe does not turn the daily pivot levels into independently calculated hourly or five-minute pivots.
Core Features
- Automatic calculation of daily pivot points.
- Three support and three resistance levels.
- Intermediate lines between consecutive levels.
- Daily price calculations using open, high, low, and close values.
- Display of daily pivot levels across different chart timeframes.
- Optional daily candle display and current-day box.
Best for
- Identifying potential intraday support and resistance zones.
- Assessing bullish and bearish conditions around the central pivot.
- Planning breakout entries beyond established price levels.
- Locating potential reversal areas after price rejects support or resistance.
- Mapping possible profit targets and evaluating trade risk.
Best Markets
- EURUSD: A liquid major pair with frequent intraday movements around established price levels.
- GBPUSD: Useful for analysing breakouts and pullbacks during active London trading hours.
- USDJPY: Suitable for monitoring directional moves and reactions around daily pivot levels.
- EURJPY: Offers opportunities to study intraday momentum and resistance breaks.
- Gold (XAUUSD): Can be analysed with daily pivots, although its higher volatility requires careful risk management.
Trading Styles
- Intraday trading: Use M15 and M30 charts to identify potential entries around daily levels.
- H1 trend trading: Assess the broader intraday direction and wait for confirmation around the pivot or a key resistance or support level.
- Breakout trading: Monitor M5 and M15 charts for price to move decisively beyond an established level.
- Pullback trading: Look for price to retest a broken pivot, support, or resistance level before considering an entry.
- Reversal trading: Watch for rejection candles near an important level, supported by additional price-action evidence.
How Traders Use It
A common approach is to assess price relative to the central pivot before looking for an entry.
When price remains above the pivot and breaks through the first resistance level, a potential long setup may develop.
A move below the pivot followed by a decisive break of the first support level can indicate a possible short setup.
Getting More from H1 Charts
The H1 timeframe is particularly useful because each candle represents one hour of price movement.
This helps distinguish sustained directional moves from brief fluctuations that may appear on lower timeframes.
For example, if EURUSD holds above the central pivot and forms higher lows on H1, a trader can monitor the next resistance level as a potential target.
If price breaks below support and continues forming lower highs, the next support level becomes a reference for a possible bearish continuation.
H1 analysis can also help filter lower-timeframe signals.
A setup on M5 or M15 that aligns with the hourly direction may deserve closer attention than one that moves against the prevailing structure.
Confirmation remains important, as pivot levels do not guarantee a breakout or reversal.
Get Instant Free Access
Indicator Settings
- Indicator_on: Enables or disables the indicator.
- Use_For_Forex: Enables the forex calculation option.
- Use_Day_Formula: Enables daily calculation logic.
- Exit_Period_Choices: Applies the available exit-period rules.
- Exit_If_Period_Greater_Than: Sets the threshold used by the exit-period rule.
- Show_Day_Candle: Enables the daily candle display.
- Shift_Daycandle_right: Controls the horizontal shift of the daily candle.
- Show_Today_Box: Displays a box around the current day.
- Today_Box_Color: Sets the colour of the current-day box.
Important Notes
- Pivot levels are calculated reference points, not guaranteed turning points or entry signals.
- Check the indicator’s plotted levels and daily calculations against the broker’s price data.
- Use price action, trend analysis, or other confirmation methods to assess potential setups.
- Set stop-loss levels according to market volatility and the trading setup rather than relying on pivot lines alone.
- The indicator’s exit-related settings may affect its additional logic; verify their exact behaviour in the available version before using them in a live strategy.