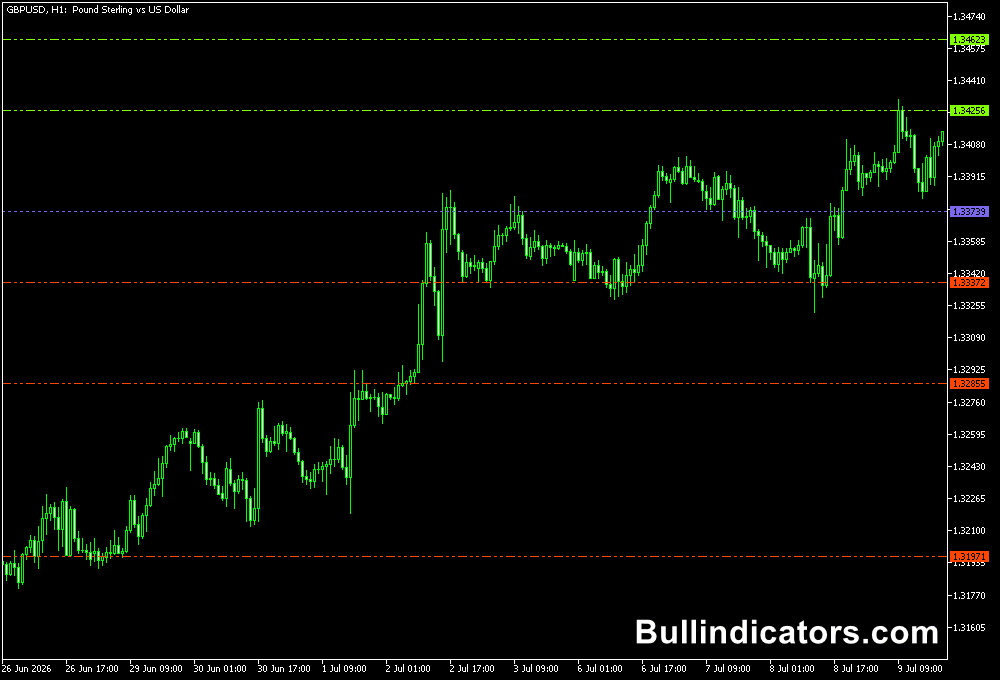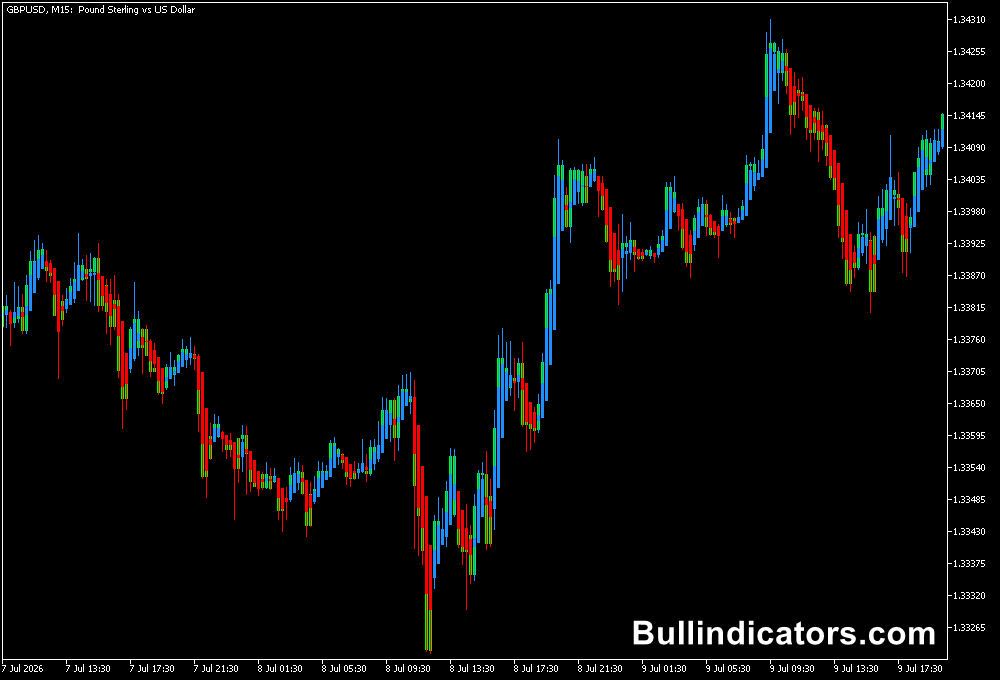
The Absolutely No Lag LWMA indicator for MT5 is a simple trend-following tool that uses a 15-period Linear Weighted Moving Average (LWMA) to display market direction directly on the price chart.
It helps identify bullish and bearish conditions by tracking the relationship between the moving average and closing prices.
The indicator can be applied to forex pairs, stock indices, commodities, and other assets supported by MetaTrader 5.
The LWMA gives greater weight to recent price data than a simple moving average, allowing it to respond more quickly to changing market conditions.
Despite its name, however, the indicator cannot eliminate lag or predict future price movements.
Its responsiveness can also make it more sensitive to short-term fluctuations, particularly in sideways markets.
Why Traders Use the Absolutely No Lag LWMA Indicator for MT5
The main advantage of this indicator is its straightforward presentation of trend direction.
When the LWMA slopes upward and candles close above the line, bullish momentum may be developing.
When the line slopes downward and price closes below it, bearish conditions may be taking shape.
The moving average also acts as a dynamic reference level.
During an established trend, price may pull back towards the LWMA before continuing in the prevailing direction.
This can help identify potential entry areas and provide a reference for managing open positions.
However, its sensitivity has an important disadvantage.
On short timeframes, price can cross above and below the LWMA repeatedly, generating frequent false signals within a short period.
In ranging markets, these changes can lead to repeated entries and losses.
The indicator is generally more useful when combined with market structure, support and resistance, and confirmation from a higher timeframe.
Download This MT5 Indicator for Free
Indicator Chart Setup
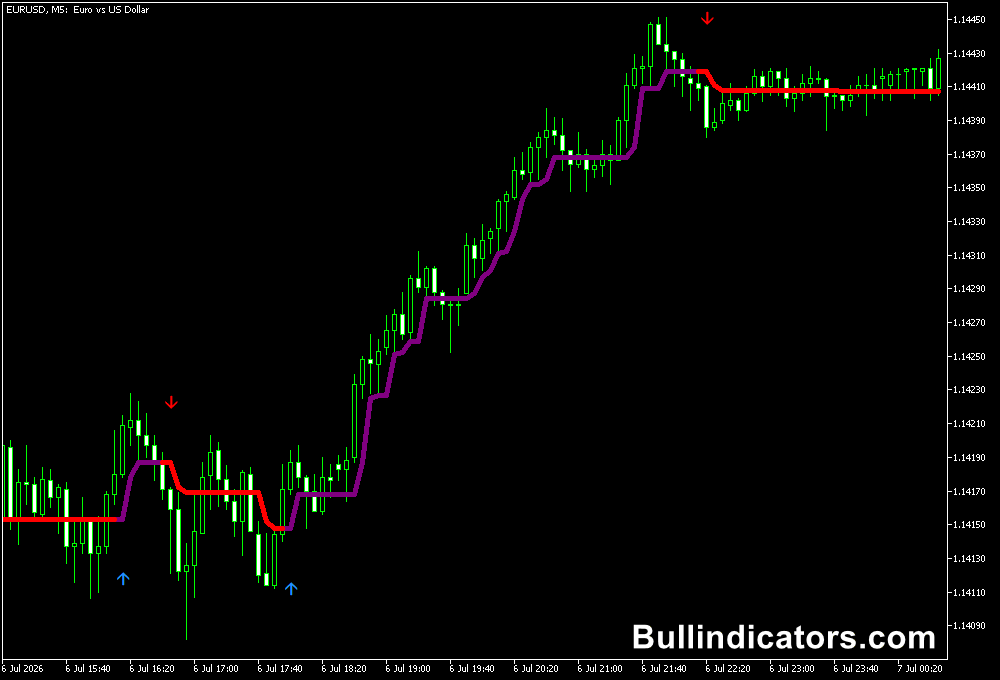
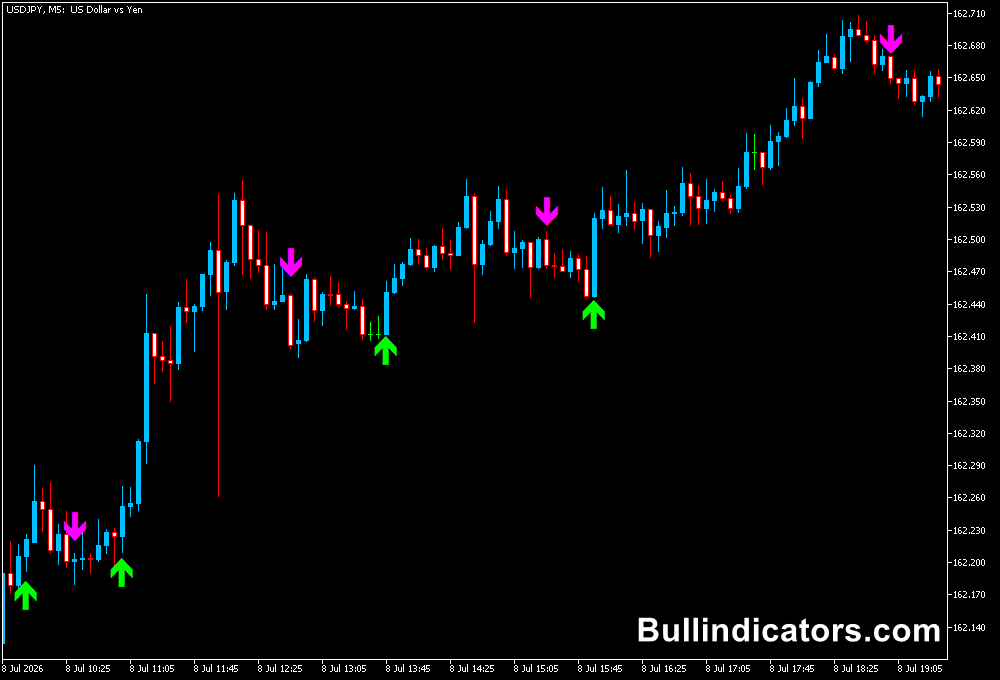
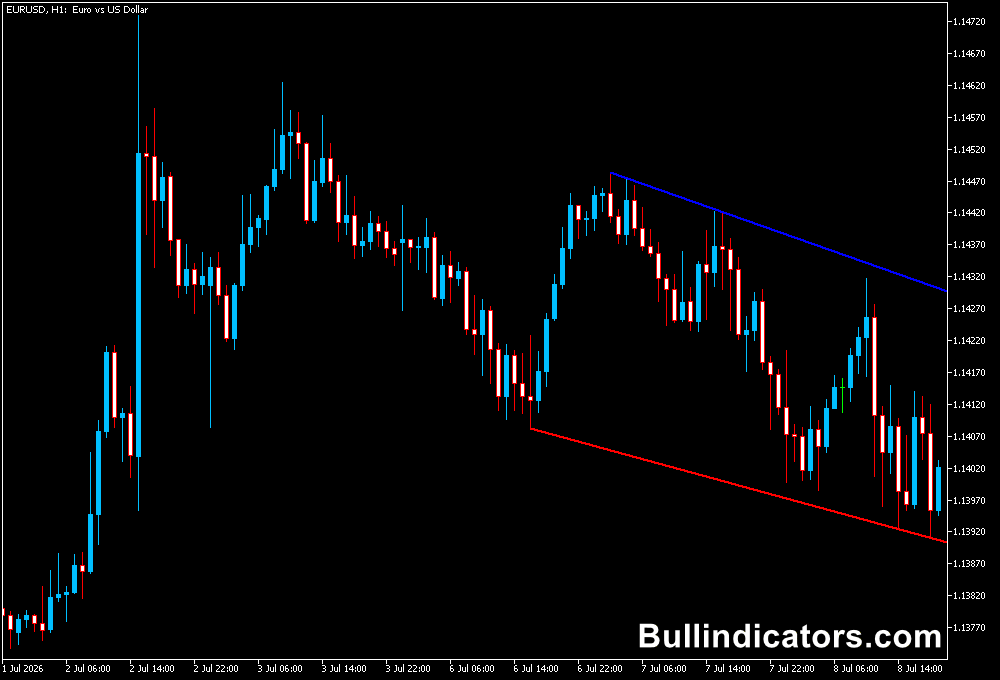
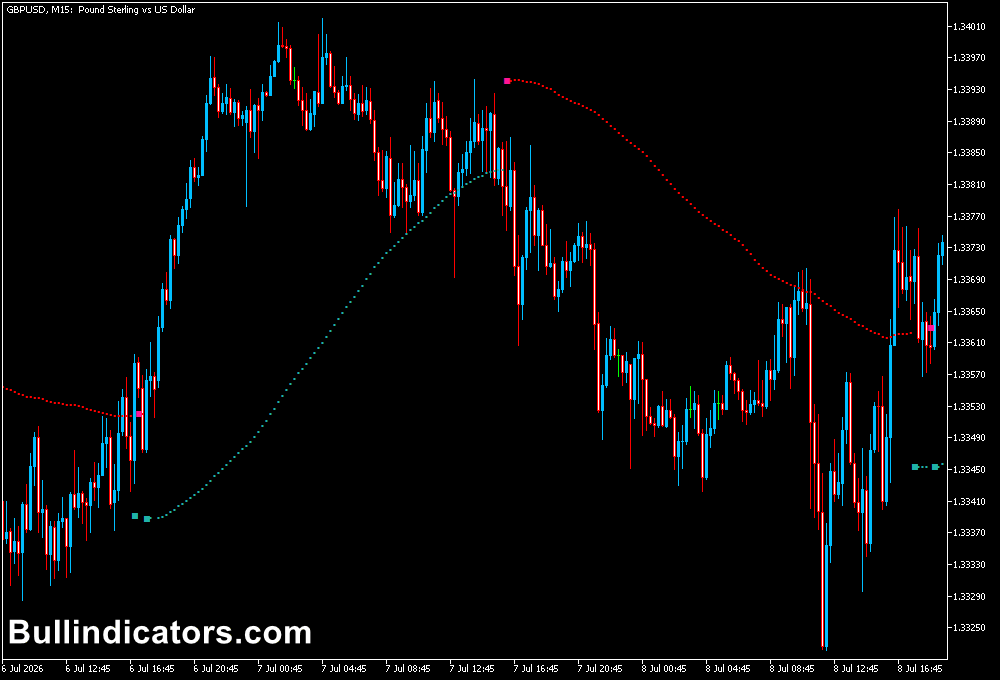
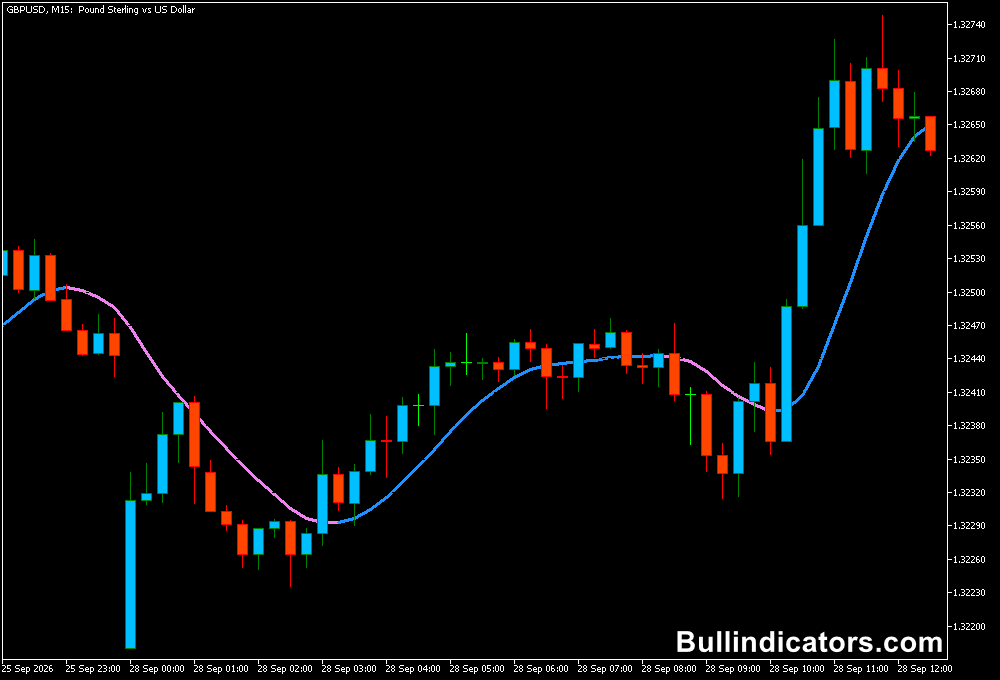
The Absolutely No Lag LWMA Indicator displays a moving average line over the price candles.
Its direction and position relative to closing prices provide the main trend information.
An upward-sloping line with candles closing above it suggests bullish conditions, while a downward-sloping line with candles closing below it suggests bearish pressure.
The LWMA can also help identify potential dynamic support during an uptrend or dynamic resistance during a downtrend.
A price rejection near the line may offer a continuation setup, while a confirmed break through it can indicate weakening momentum.
A single candle crossing the line, however, is not sufficient to establish a reliable trend reversal.
Core Features
- 15-period Linear Weighted Moving Average for trend analysis.
- Visual identification of potential bullish and bearish conditions.
- Dynamic support and resistance reference.
- Adjustable moving average period and applied price.
- Compatibility with different chart timeframes and supported trading assets.
- Simple chart presentation without multiple indicator components.
Best for
- Assessing the prevailing short-term market direction.
- Identifying potential pullbacks during established trends.
- Monitoring price reactions around a moving average.
- Planning exits when price begins moving consistently against the trend.
- Confirming trend direction alongside support, resistance, and price action.
Best Markets
- EURUSD: Suitable for trend analysis during active London and New York sessions.
- GBPUSD: Useful for monitoring directional momentum, although sharp reversals can produce false signals.
- USDJPY: Offers opportunities to assess sustained moves and pullbacks.
- Gold (XAUUSD): Can help track momentum, but volatility may cause frequent crosses around the LWMA.
- NAS100: Useful for examining directional moves when supported by clear market structure.
Trading Styles
- Intraday trading: Use M15 and M30 charts to assess directional moves and pullback opportunities.
- Trend following: Apply H1 charts to filter short-term fluctuations and identify the broader direction.
- Scalping: Use M1 or M5 charts cautiously, as repeated LWMA crosses can generate numerous false signals.
- Pullback trading: Look for price to approach the LWMA and resume moving in the prevailing trend direction.
- Multi-timeframe analysis: Check H1 trend direction before considering entries on M5 or M15.
How to Use the Indicator
A basic approach is to combine the slope of the LWMA with candle closes and the surrounding price structure.
For a potential buy setup, look for an upward-sloping line, price holding above it, and a pullback that produces bullish confirmation.
A potential sell setup requires a downward-sloping line, price trading below it, and bearish confirmation following a retracement.
For example, if EURUSD is trending higher on H1, a pullback towards the LWMA on M15 may provide an area to watch for a bullish rejection.
A possible entry can be considered after price breaks above the confirmation candle’s high, with a stop-loss below the pullback low.
The opposite approach applies to a bearish trend. These are illustrative setups, not guaranteed signals.
Get Instant Free Access
Indicator Settings
- Period: Sets the number of price bars used to calculate the LWMA. The default description specifies 15 periods.
- Price: Selects the price data used in the calculation, such as Open, Close, High, or Low.
- Colors: Adjusts the indicator’s line colour where colour customization is available.
Important Notes
- No moving average can eliminate lag completely. The name describes the indicator’s intended responsiveness, not a guarantee of immediate or predictive signals.
- Frequent price crosses can generate multiple false buy and sell signals, especially on M1 and M5 charts during sideways conditions.
- Consider waiting for candle-close confirmation and checking the broader trend before entering a trade.
- Combining the LWMA with support and resistance or higher-timeframe analysis may help filter weak signals, but does not eliminate risk.
- Test the indicator under different market conditions before using it in live trading, and always apply appropriate stop-loss and position-sizing rules.