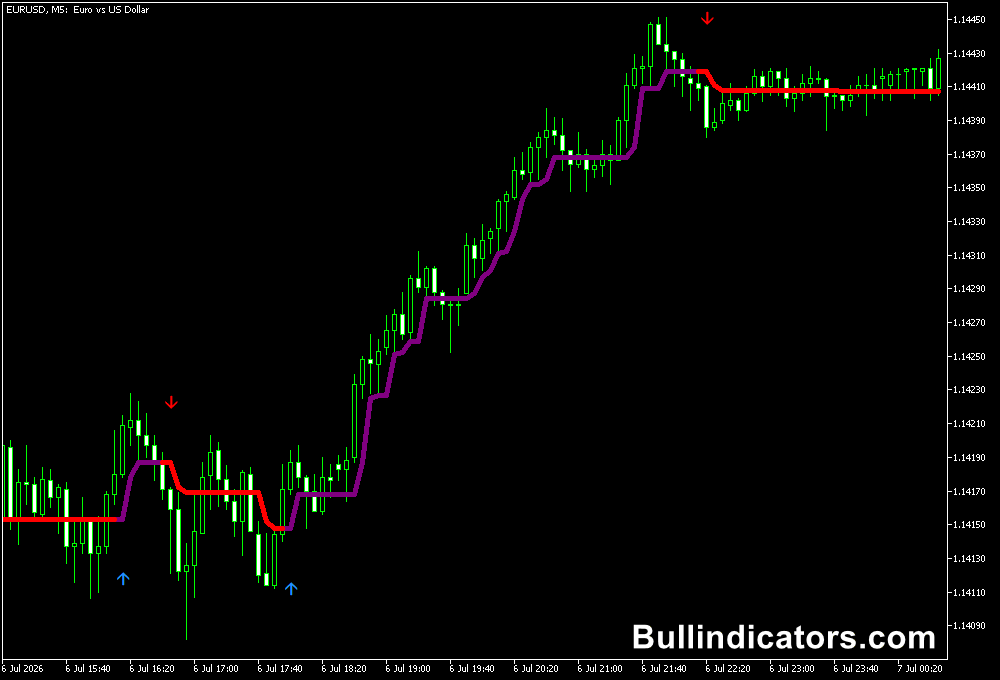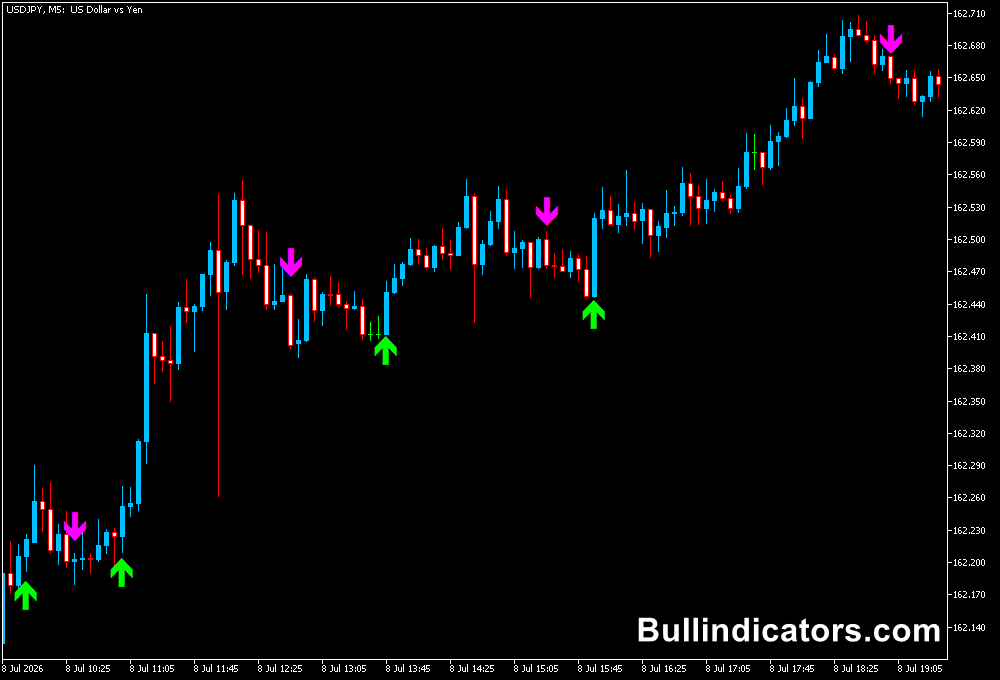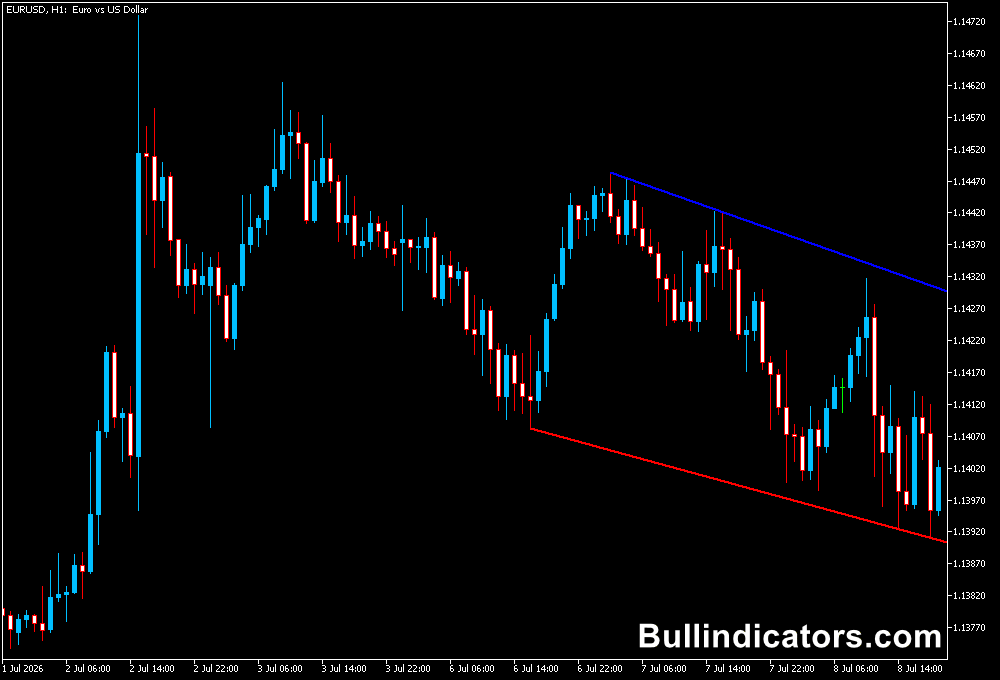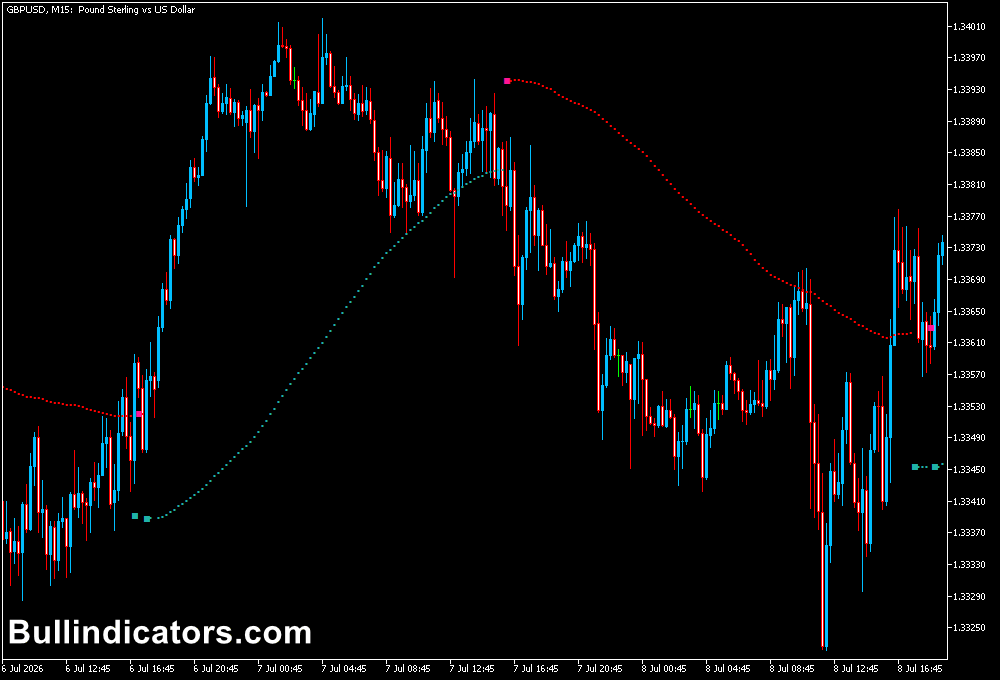
The Cycle Identifier indicator for MT5 is a momentum and trend analysis tool designed to highlight changes in market cycles.
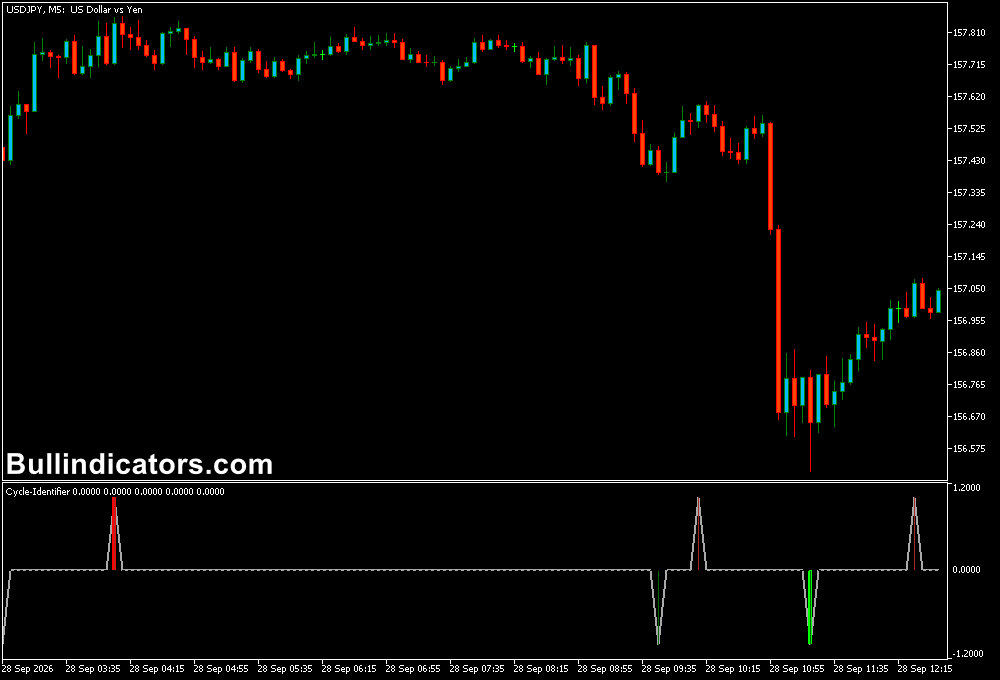
Displayed in a separate window below the main price chart, it uses a fluctuating grey line and coloured bars to indicate bullish and bearish movements.
The indicator combines concepts associated with moving averages, the Relative Strength Index (RSI), and price action filtering to help assess market direction and the strength of price movements.
Its coloured bars provide a visual distinction between weaker movements and stronger directional phases.
Thick lime bars indicate strong bullish conditions, while thick red bars indicate strong bearish conditions.
Smaller dark green and maroon bars represent weaker movements that may not provide sufficient momentum for a trade on their own.
Why Traders Use the Cycle Identifier Indicator for MT5
The Cycle Identifier helps identify periods when momentum appears to be building in one direction.
By distinguishing stronger cycle movements from weaker ones, it can help filter potential entries and avoid acting on every minor price fluctuation.
For better results, combine it with a trend indicator such as the Absolutely No Lag LWMA Indicator for MT5.
The LWMA provides a visual reference for the prevailing trend, while the Cycle Identifier highlights momentum conditions.
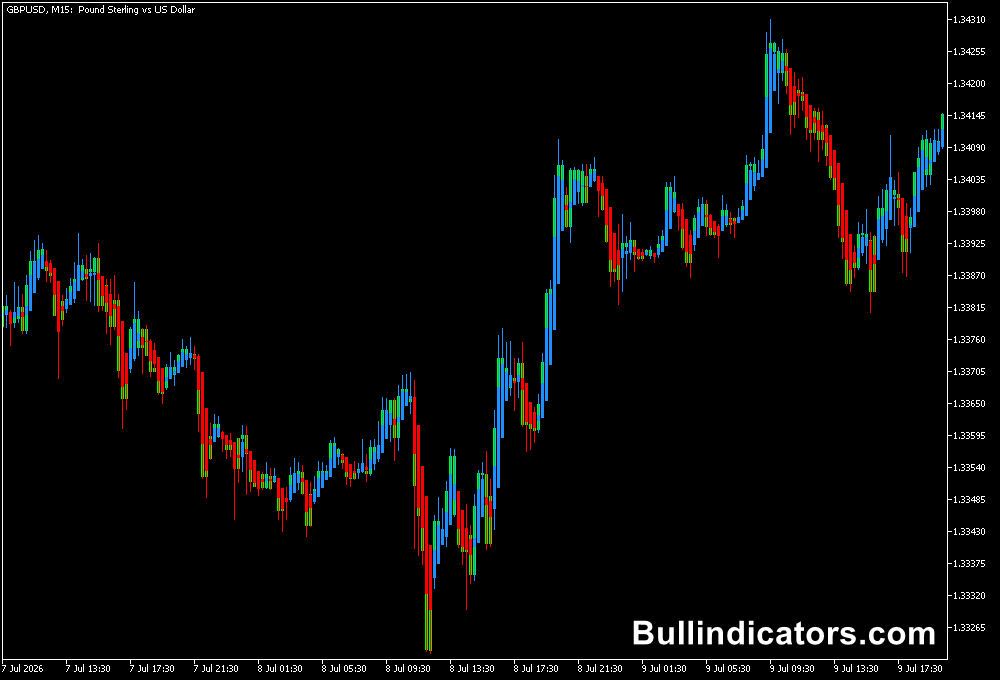
An upward-sloping blue LWMA line indicates a bullish trend, while a magenta line indicates a bearish trend.
Taking trades in the direction of the LWMA can help filter cycle signals that run against the broader market direction.
This combination is useful for intraday setups because it separates trend direction from momentum confirmation.
However, neither indicator guarantees that a trend will continue, and both can produce misleading signals when the market moves sideways.
Download This MT5 Indicator for Free
Indicator Chart Setup
The Cycle Identifier appears in a separate indicator window beneath the price chart.
A grey line fluctuates around the zero level, accompanied by coloured bars at selected peaks and troughs.
Lime and dark green bars are associated with bullish cycle movements, while red and maroon bars indicate bearish movements.
Bar thickness helps distinguish stronger signals from weaker ones.
Thick lime bars indicate stronger bullish momentum, while thick red bars indicate stronger bearish momentum.
Thin bars represent less pronounced movements and should be assessed cautiously rather than treated as automatic entry instructions.
When used alongside the Absolutely No Lag LWMA indicator, the main chart provides the trend filter and the lower indicator window provides additional momentum information.
For example, a thick lime bar appearing while the LWMA slopes upward in blue offers a potential bullish setup to investigate.
A thick red bar accompanied by a magenta, downward-sloping LWMA suggests a potential bearish setup.
Core Features
- Separate-window display for cycle and momentum analysis.
- Grey signal line fluctuating around the zero level.
- Colour-coded bars for bullish and bearish movements.
- Thick and thin bars to distinguish stronger and weaker cycle activity.
- Adjustable price-action sensitivity and signal length.
- Can be combined with the Absolutely No Lag LWMA Indicator for trend confirmation.
Best for
- Identifying periods of stronger bullish or bearish momentum.
- Confirming potential entries in the direction of the prevailing trend.
- Filtering weaker cycle signals with a separate trend indicator.
- Monitoring possible momentum changes during an open position.
- Combining cycle analysis with price structure and support or resistance.
Best Markets
- EURUSD: Suitable for intraday trend and momentum analysis during active trading sessions.
- GBPUSD: Useful for monitoring directional momentum, particularly during London trading.
- USDJPY: Offers opportunities to assess cycle movements during sustained directional phases.
- Gold (XAUUSD): Can be used to examine momentum changes, although volatility may produce abrupt reversals.
- NAS100: Useful for evaluating directional momentum during active market hours, with careful risk management.
Trading Styles
- Scalping: Use M1 or M5 charts cautiously, taking signals only when they align with the trend filter.
- Intraday trading: Apply M5 and M15 charts to identify potential momentum entries in the direction of the prevailing trend.
- Trend following: Use M15 or H1 charts to combine cycle confirmation with the direction of the LWMA.
- Swing trading: Consider H4 charts for broader momentum analysis and potential continuation setups.
How to Use the Indicator
A practical approach is to check the LWMA direction first, then look for a matching Cycle Identifier signal.
Avoid taking a position solely because a coloured bar appears; consider the current price structure, nearby support or resistance, and the quality of the setup.
Example of a Buy Entry
Suppose EURUSD is trading on M15 and the Absolutely No Lag LWMA line slopes upward in blue.
Price is holding above the moving average, and a thick lime bar appears in the Cycle Identifier window.
This combination suggests that bullish momentum may be supporting the prevailing trend.
A possible entry can be considered after a bullish confirmation candle closes, with a stop-loss below the recent pullback low. The next resistance level can serve as a potential profit target.
Example of a Sell Entry
Suppose GBPUSD is trading on M5 and the LWMA line slopes downward in magenta.
Price remains below the moving average, and a thick red bar appears in the Cycle Identifier window.
This alignment suggests that bearish momentum may support a short setup.
Consider an entry after a bearish confirmation candle closes, with a stop-loss above the recent pullback high.
A nearby support level can provide a reference for a potential exit.
These examples are illustrative. If the LWMA direction and Cycle Identifier signals disagree, waiting for clearer alignment may help avoid low-quality entries.
Get Instant Free Access
Indicator Settings
- PriceActionFilter: Controls sensitivity to price movements. Lower values make the indicator more sensitive and may increase the number of signals.
- Length: Sets the number of bars or candlesticks considered when evaluating signals.
- MajorCycleStrength: Influences the distinction between thin and thick bars. Lower values produce more thick bars.
- UseCycleFilter: Enables or disables the cycle filter. The supplied instructions recommend setting this option to false; test the effect of this setting before live use.
Important Notes
- Thick bars indicate stronger measured cycle activity, not guaranteed profitable trading opportunities.
- Lower PriceActionFilter values can generate more frequent signals, including false signals in choppy markets.
- Use the LWMA trend direction as a filter and avoid trading against the prevailing direction without a separate reversal strategy.
- Closing a position at the first opposite-coloured bar may exit too early during temporary pullbacks. Assess price structure and risk before deciding when to close.
- Test the indicator combination on historical data and in a demo account before risking real funds.