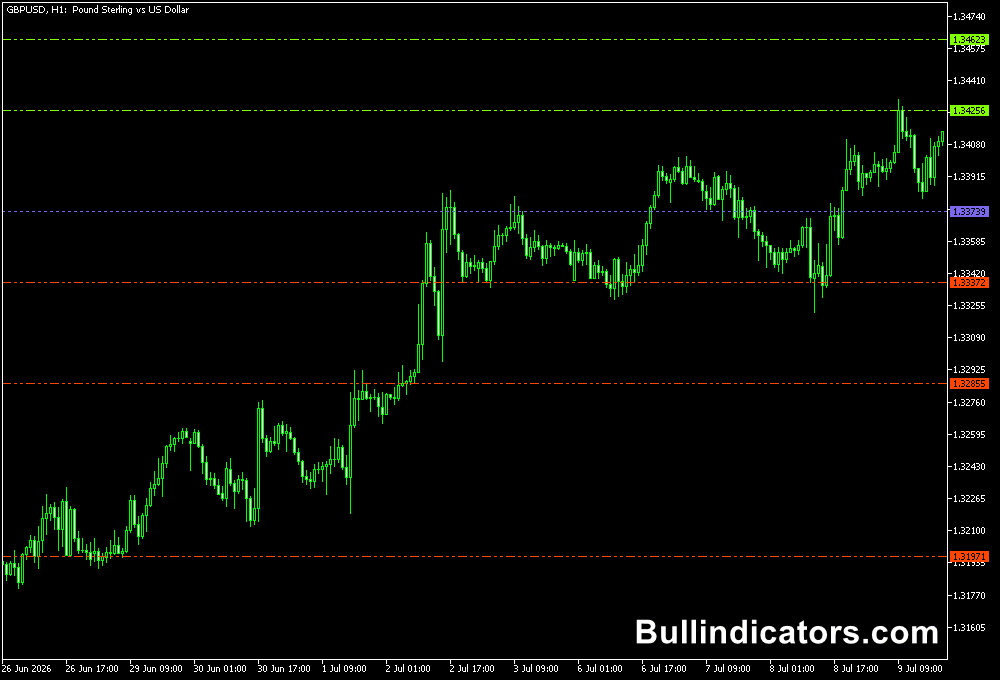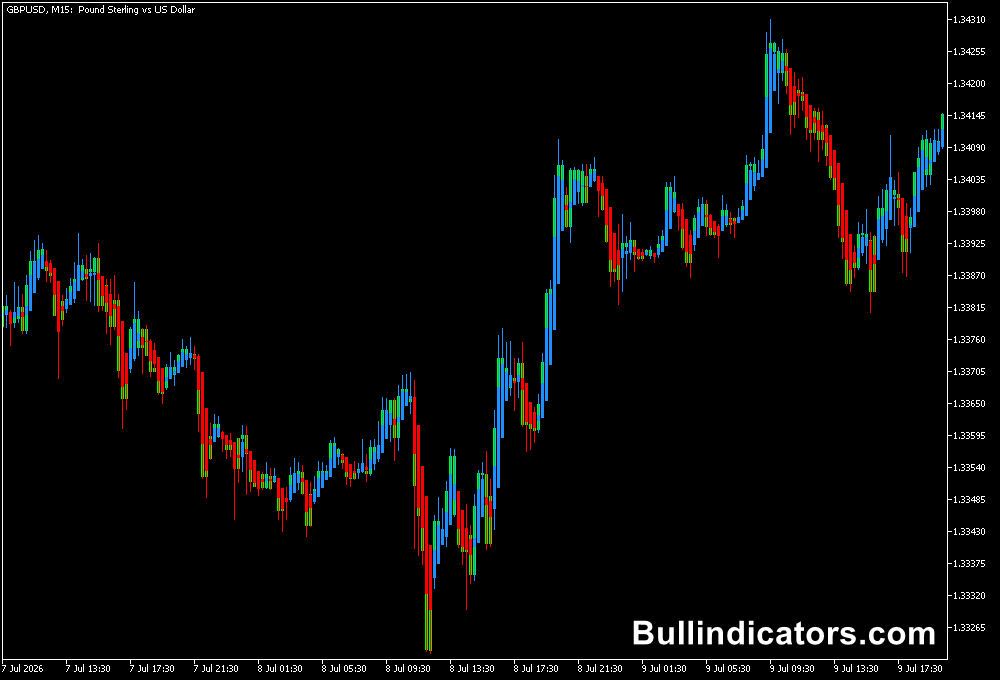
The Synthetic VIX indicator for MT5 is a volatility analysis tool that measures price movements using historical market data.
Originally inspired by volatility analysis in the S&P 500 market, this indicator can also be applied to forex pairs, commodities, indices, and other instruments available in MetaTrader 5.
The indicator calculates a synthetic volatility reading based on the highest closing price over a selected period and the current bar’s low.
Its value helps assess how far price has moved from a recent high.
Rather than generating direct buy and sell signals, it provides additional information about changing market conditions, potential momentum shifts, and possible breakout opportunities.
Why Traders Use the Synthetic VIX Indicator for MT5
Volatility can help explain whether a market is quiet, expanding into a stronger move, or experiencing a sharp fluctuation.
The Synthetic VIX provides a numerical reading that can be monitored alongside price action to assess these conditions.
One useful application is analysing price after a period of consolidation.
When price remains inside a narrow range, changes in the indicator may provide additional context as the market approaches a potential breakout.
The indicator can also help assess whether a price move is accompanied by changing volatility, although it cannot predict the direction or success of a breakout on its own.
Its value is particularly useful when comparing M15 and H1 charts.
M15 offers a closer view of short-term volatility changes, while H1 helps assess whether those movements occur within a broader market structure.
Combining both timeframes can provide a more complete view of potential trading opportunities.
Download This MT5 Indicator for Free
Indicator Chart Setup
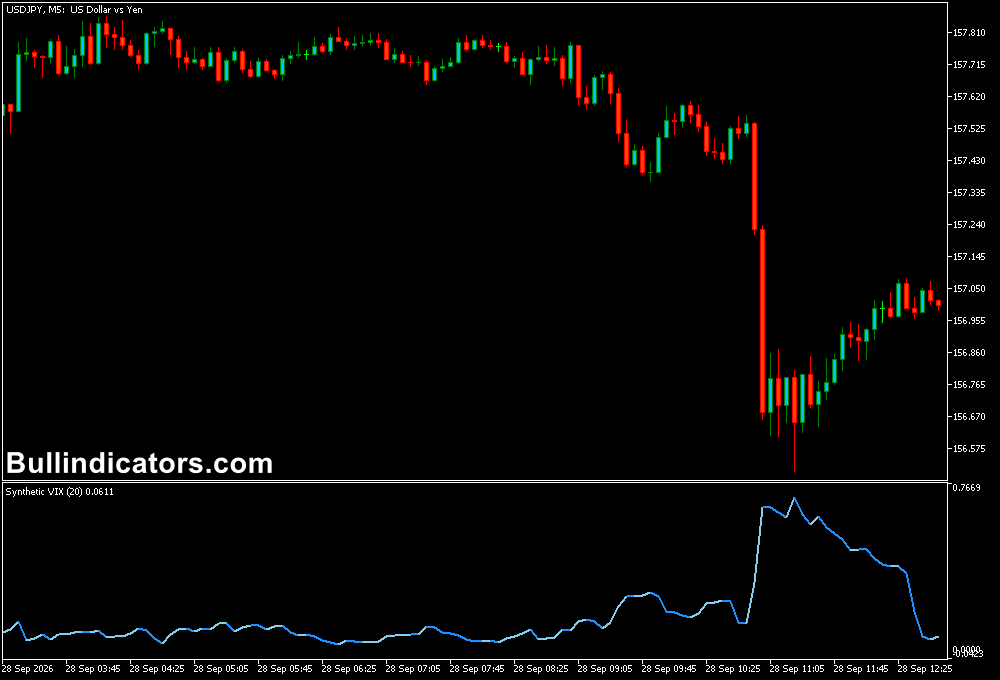
The Synthetic VIX Indicator displays a numerical volatility reading in an indicator window.
Its calculation uses the highest closing price over the selected lookback period and the low of the current bar. The reading changes as new price data becomes available.
The supplied calculation is:
Synthetic VIX = (Highest Close over the selected period − Current Low) ÷ Highest Close over the selected period
The result can be multiplied by 100 to express the reading as a percentage.
However, the exact display scale depends on the indicator’s implementation.
A rising reading indicates that the current low is moving further below the highest close in the lookback window, while a falling reading indicates that this distance is narrowing.
This is a price-distance measure and should not be confused with the official CBOE VIX index.
Core Features
- Measures price distance from a recent highest closing price.
- Uses an adjustable lookback period.
- Provides a numerical reference for changing market conditions.
- Supports volatility analysis on multiple chart timeframes.
- Can be combined with price action, support and resistance, and trend indicators.
- Helps assess consolidation and potential breakout environments without generating standalone trade signals.
Best for
- Monitoring changes in price volatility.
- Assessing markets approaching support or resistance.
- Studying volatility during consolidation and breakout attempts.
- Comparing short-term movements with broader market conditions.
- Adding volatility context to an existing trading strategy.
Best Markets
- EURUSD: Suitable for studying volatility changes around major session openings.
- GBPUSD: Useful for monitoring price expansion during active London and New York sessions.
- USDJPY: Can help assess changing price ranges during directional moves.
- Gold (XAUUSD): Useful for examining volatility expansion, although sharp fluctuations require careful risk management.
- US500: Can be used to study price volatility in the index market that originally inspired VIX-style analysis.
Trading Styles
- Intraday trading: Use M15 to monitor short-term volatility changes around important price levels.
- Trend trading: Use H1 to assess volatility changes alongside the prevailing trend.
- Breakout trading: Monitor volatility as price approaches the boundaries of a consolidation range.
- Swing trading: Use H1 to assess developing price movements, with H4 providing additional context where appropriate.
How to Use the Indicator
The Synthetic VIX should be treated as a supporting analytical tool rather than a directional signal generator.
A rising reading does not automatically mean price will fall, and a falling reading does not guarantee that price will rise.
The indicator measures a distance between price references, so its movements must be interpreted alongside the actual chart.
Using the M15 and H1 Timeframes
On M15, the indicator can help monitor volatility changes as price approaches an intraday support or resistance level.
For example, if EURUSD consolidates between 1.0820 and 1.0840, a change in the Synthetic VIX reading can be observed as price tests either boundary.
A confirmed breakout beyond the range, supported by candle closes and market structure, may provide a potential entry opportunity.
On H1, the same indicator provides a broader view of price distance from the highest close in the lookback period.
This can help distinguish a short-lived fluctuation from a larger move developing around an important level.
A practical approach is to establish the main support and resistance zones on H1, then use M15 to monitor a potential entry.
The indicator adds volatility context but does not independently confirm the breakout direction.
Example of a Buy Entry
Assume EURUSD is trading at 1.0840 after consolidating between 1.0820 and 1.0840 on M15.
The Synthetic VIX reading begins to decline from 0.018 to 0.012, while price closes above the range at 1.0845.
This indicates that the measured distance from the recent highest close has narrowed, but the reading alone does not confirm bullish momentum.
If the breakout candle closes above resistance and a subsequent retest holds near 1.0840, a potential buy entry could be considered around 1.0846.
A stop-loss might be placed at 1.0818, below the range, with a target of 1.0902.
The illustrative setup has 28 pips of risk and 56 pips of potential reward, giving a 1:2 risk-to-reward ratio before costs.
Example of a Sell Entry
Assume GBPUSD is trading near 1.2700 on M15, with support at 1.2680 and resistance at 1.2720.
The Synthetic VIX reading rises from 0.010 to 0.016 as price approaches the lower boundary.
Price then closes below 1.2680 at 1.2675.
If a subsequent retest fails near 1.2680 and bearish price action confirms the breakdown, a potential sell entry could be considered around 1.2674.
A stop-loss at 1.2702 would represent 28 pips of risk, while a target at 1.2618 would offer 56 pips of potential reward.
Get Instant Free Access
Indicator Settings
- VIX Period: Sets the lookback period used to identify the highest closing price. A period of 20 provides a longer reference window on daily charts, but on M15 or H1 it represents 20 bars unless the indicator specifically converts the setting to days.
Important Notes
- The Synthetic VIX is not the official CBOE VIX and does not directly measure implied volatility from S&P 500 options.
- A rising reading measures an increasing distance between the current low and the highest close in the selected period; it does not guarantee a bearish move.
- A falling reading does not guarantee bullish continuation or a successful upside breakout.
- On M15 and H1, confirm the indicator’s lookback behaviour and numerical scale before interpreting readings.
- Use price structure, candle closes, and appropriate stop-loss placement to manage risk. Test the indicator on historical data and in a demo account before live trading.