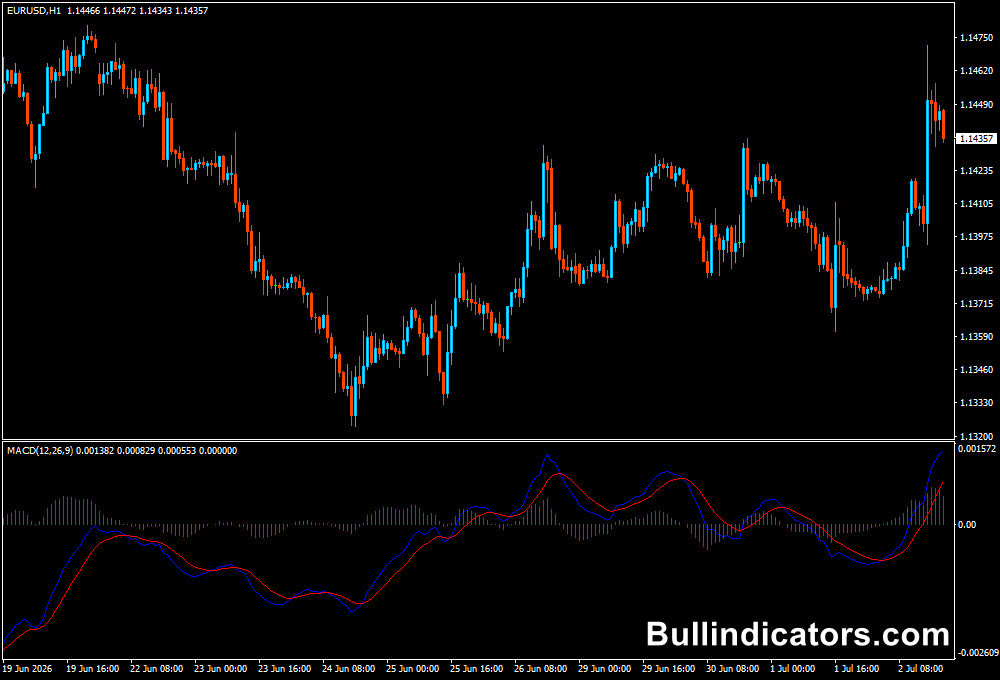
The Market Structure Volume Distribution Indicator for MT4 is a price action and volume-based tool that combines structural market analysis with volume profiling.
It highlights how price moves through different phases of the market while showing where buying and selling activity is concentrated across different price areas.
This helps traders understand not just direction, but also the strength, participation, and intent behind each move in the market.
Why traders use Market Structure & Volume Distribution
Traders use this indicator because it connects market structure with volume behavior, giving a clearer picture of what is driving price movement.
Instead of relying only on swings or breakouts, it shows where real participation is happening in the market.
This helps traders identify stronger trends, avoid weak or low-volume moves, and focus on areas where liquidity and institutional activity are more likely to influence price.
Download This MT4 Indicator for Free
Indicator Chart Setup
The indicator is applied directly on the main price chart.
It overlays market structure levels and volume distribution zones on price action, allowing traders to analyze structure shifts without switching to a separate window or sub-chart.
This setup keeps all relevant trading information in one view, making it easier to track momentum changes, liquidity areas, and potential reaction zones as they develop in real time.

Core Features
- Market structure phases including swings, breaks, and shifts
- Volume distribution across key price levels where activity is concentrated
- High-interest trading zones where liquidity builds up over time
- Areas where price reacts to institutional participation and order flow activity
- Potential reversal or continuation zones based on changes in volume behavior
Best for
- Identifying trend direction and structural shifts in price action
- Spotting accumulation and distribution phases during market cycles
- Timing entries after confirmed break of structure signals
- Filtering weaker setups during low participation or unstable conditions
Best Markets
- Major and minor Forex pairs with sufficient volatility
- Indices such as US30, NAS100, GER40
- Commodities like gold, silver, and crude oil
- Crypto assets with consistent trading volume
Trading Styles
- Intraday trading setups
- Day trading strategies
- Swing trading approaches
- Structure-based price action trading systems
How traders use it
Traders use the indicator to combine volume behavior with market structure logic in a single framework.
A break of structure accompanied by strong volume activity is often interpreted as confirmation that momentum is continuing in the same direction.
When price returns to high-volume zones, traders often watch for reactions such as rejection, consolidation, or continuation before entering a trade.
It is also used to avoid entries in low-volume areas where price tends to move unpredictably or without clear direction.
Get Instant Free Access
Indicator Settings
- Volume sensitivity adjustment to reduce noise and filter weak signals
- Structure detection strength for identifying swing points more accurately
- Zone display settings for cleaner visual interpretation
- Lookback period controlling how far historical structure is analyzed
Important Notes
- Volume data may differ depending on broker feed quality
- False breakouts can occur during ranging or low-liquidity conditions
- Higher timeframes generally provide more reliable structure signals
- Best results come when combined with trend or momentum confirmation tools
- Overtrading in low-volume environments can reduce effectiveness