
The MACD 2 Line Indicator for MT4 is an enhanced version of the traditional MACD oscillator that displays two exponential moving average (EMA) lines together with a color-coded histogram.
By separating the fast and slow EMA into individual lines, the indicator provides clearer crossover signals while the histogram measures bullish and bearish momentum.
This combination helps traders identify trend reversals, momentum shifts, and trend continuation opportunities with greater precision.
Why traders use the MACD 2 Line Indicator
Many traders prefer the MACD 2 Line Indicator because it offers more visual information than the standard MACD.
The crossover between the fast and slow EMA lines provides straightforward entry signals, while the histogram helps confirm whether buying or selling momentum is increasing.
The zero line serves as an additional trend filter, allowing traders to judge whether momentum favors buyers or sellers.
The indicator performs well across multiple trading styles, from short-term scalping to longer-term trend trading.
Many traders also combine it with the 100 EMA on the main chart, taking only BUY signals when price remains above the 100 EMA and SELL signals when price stays below it.
This simple trend filter can significantly improve signal quality.
Download This MT4 Indicator for Free
Indicator Chart Setup
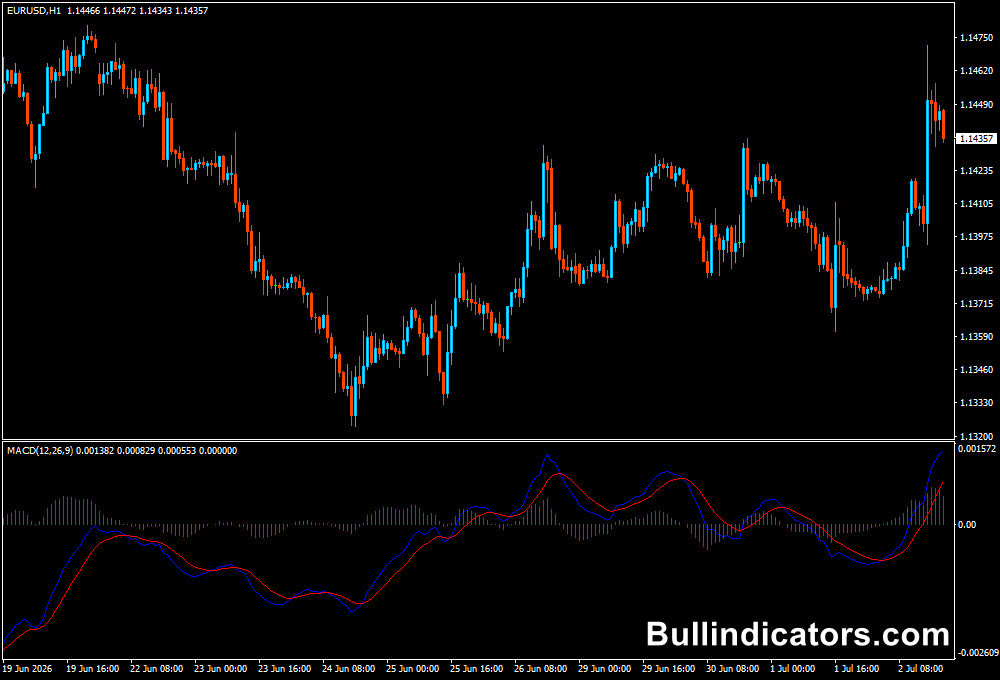
After attaching the indicator to MT4, a separate indicator window appears below the main price chart.
It displays a blue fast EMA line, a red slow EMA line, a green and red momentum histogram, and a central zero line.
Bullish signals develop when the fast EMA crosses above the slow EMA, while bearish signals occur when the fast EMA crosses below the slow EMA.
Histogram color changes provide additional confirmation of momentum direction.
Core Features
- Fast and slow EMA crossover signals
- Color-coded bullish and bearish histogram
- Zero-line momentum confirmation
- Suitable for multiple timeframes
- Customizable EMA settings
- Simple and easy-to-read interface
Best for
- Spotting trend reversals
- Momentum confirmation
- Trend continuation entries
- Filtering market direction
- Combining with moving averages
Best Markets
- Major Forex pairs
- Stock indices
- Gold (XAU/USD)
- Silver (XAG/USD)
- Liquid CFD markets
Trading Styles
- Scalping
- Day trading
- Swing trading
- Position trading
- Trend trading
How traders use it
Many traders wait for the fast EMA to cross above the slow EMA while the histogram turns green before considering a long position.
For short trades, they look for the opposite crossover together with a red histogram.
Additional confirmation is often taken from the zero line, with bullish setups carrying greater weight above zero and bearish setups below it.
Combining these signals with the 100 EMA helps traders stay aligned with the prevailing trend and avoid trading against stronger market momentum.
Get Instant Free Access
Indicator Settings
- Fast EMA: Sets the calculation period for the fast exponential moving average.
- Slow EMA: Sets the calculation period for the slow exponential moving average.
- Signal EMA: Defines the smoothing period used for signal generation.
Important Notes
- Use the 100 EMA as a higher-level trend filter for improved trade selection.
- Signals become more reliable when confirmed by price action or support and resistance.
- The zero line helps distinguish bullish and bearish market momentum.
- Lower EMA settings generate more signals, while higher settings reduce market noise.
- Always apply sound risk management before entering any position.









