
The Advanced ADX Indicator for MT4 is a trend tool that simplifies the classic Average Directional Movement Index (ADX) by replacing the traditional +DI and -DI lines with an easy-to-read color histogram.
This allows you to quickly determine both the direction and strength of the current market without interpreting multiple indicator lines.
Green histogram bars indicate bullish momentum, while red histogram bars signal bearish momentum.
The clean visual presentation makes it easy to recognize trend changes and remain in profitable positions as long as momentum continues.
Whether you trade Forex, indices, commodities, or CFDs, this tool provides valuable confirmation before entering a position.
Why traders use the Advanced ADX Indicator
The standard ADX indicator is excellent for measuring trend strength, but interpreting the DI+ and DI- lines can be challenging, especially during fast-moving markets.
The Advanced ADX Indicator removes this complexity by converting the information into a simple color histogram that immediately reveals the dominant market direction.
Many traders use it as a standalone trend filter, while others combine it with moving averages, support and resistance levels, or candlestick patterns for additional confirmation.
Since the histogram remains the same color during strong trends, it also helps traders stay in winning positions instead of exiting too early.
The indicator works on every timeframe, although higher timeframes generally produce more reliable trend signals with less market noise.
Download This MT4 Indicator for Free
Indicator Chart Setup
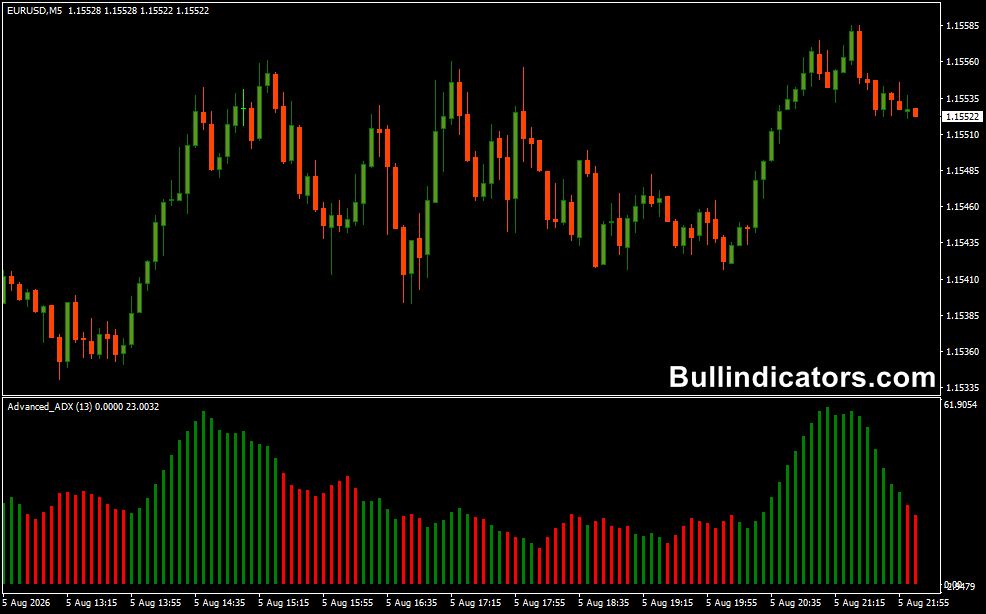
The indicator appears in a separate window below the price chart as a colored histogram.
Green bars represent bullish market conditions, while red bars indicate bearish momentum.
Whenever the histogram changes color, it signals that market direction may be shifting.
Remaining bars of the same color suggest that the existing trend is still active.
Core Features
- Simplified ADX histogram for easier trend analysis.
- Green histogram for bullish momentum.
- Red histogram for bearish momentum.
- Provides clear buy and sell signals.
- Helps measure trend strength.
- Suitable for all MT4 timeframes.
- Works well with other technical tools.
Best for
- Following established market trends.
- Identifying momentum shifts.
- Filtering low-quality trade setups.
- Holding positions during strong trends.
- Confirming entries with price action.
Best Markets
- EUR/USD for steady intraday trends.
- GBP/USD during the London session.
- GBP/JPY for high-volatility momentum trading.
- USD/CAD around North American trading hours.
- Gold (XAU/USD) during active market sessions.
- Major Forex pairs with consistent liquidity.
Trading Styles
- Intraday trading.
- Trend following.
- Momentum trading.
- Swing trading.
- Breakout trading.
- Multi-timeframe analysis.
How traders use it
A straightforward approach is to trade only in the direction indicated by the histogram.
A new green histogram often signals the beginning of bullish momentum, while a new red histogram suggests sellers are taking control.
Many traders wait for the candle that confirms the color change before opening a position.
The histogram can also serve as a trend filter.
For example, if price reaches a support level while the histogram remains green, buyers may have a higher probability of continuing the existing trend.
Likewise, resistance levels become more attractive for short positions when the histogram stays red.
GBP/JPY M15 Trading Example
On the GBP/JPY M15 chart, wait for the histogram to switch from red to green after a short pullback during an existing uptrend.
Enter a buy trade once the current candle closes above the previous candle’s high while the histogram remains green.
- Timeframe: M15
- Market: GBP/JPY
- Entry: First bullish candle after the histogram turns green.
- Stop-loss: Below the most recent swing low.
- Take-profit: Next resistance level or a minimum 1:2 risk-to-reward ratio.
- Exit early if the histogram changes back to red.
The same concept works for sell trades by waiting for the histogram to turn red and entering after bearish confirmation near resistance.
Get Instant Free Access
Indicator Settings
- ADXPeriod – Period used for calculating the Average Directional Movement Index.
- Histogram Colors – Customize bullish and bearish bar colors.
- Style – Modify histogram appearance and display style.
Important Notes
- Higher timeframes such as H1 and H4 generally provide more reliable signals.
- Green bars indicate bullish momentum, while red bars indicate bearish momentum.
- Avoid entering trades during flat or low-volatility market conditions.
- Use support and resistance or candlestick confirmation to improve entry quality.
- The indicator performs well as both a standalone trend filter and a confirmation tool.
- Always apply proper money management and predefined stop-loss levels.
- Test the indicator on a demo account before trading with real capital.









