
The TMA Centered Bands indicator for MT4 is a technical analysis tool that uses Triangular Moving Average calculations to create three dynamic price bands around the market.
These bands help identify the current trend direction, possible reversal areas, and potential entry zones.
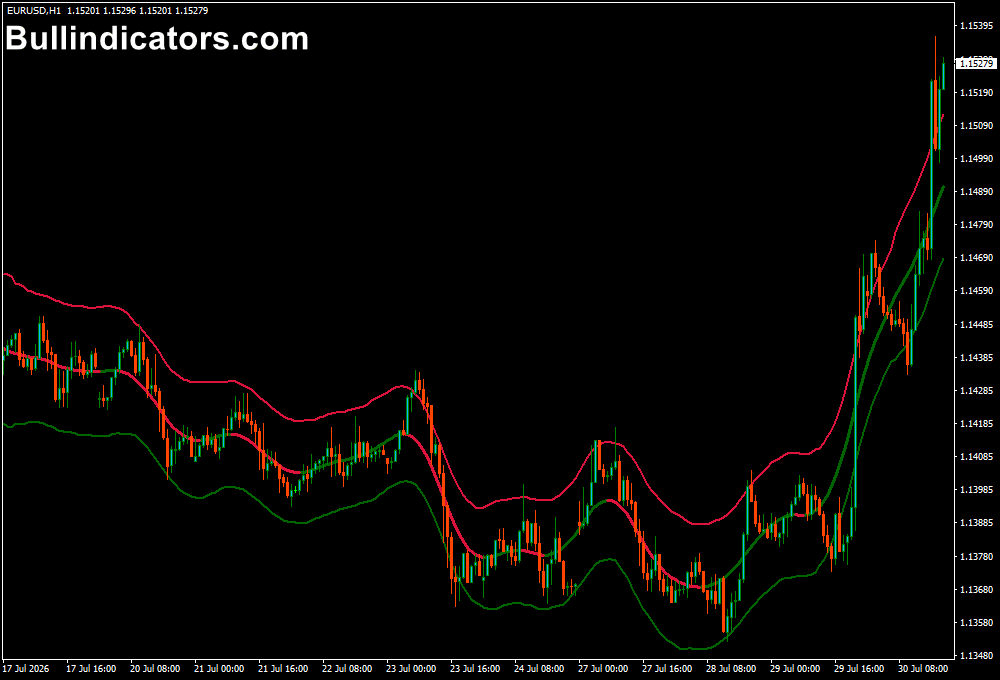
The indicator consists of an upper band, lower band, and middle trend line.
The outer bands highlight areas where price may become overextended, while the middle band provides a visual indication of market direction by changing color according to momentum.
Because the TMA Centered Bands adapts to price movement, it can be used for different trading approaches, including trend following, pullback trading, and reversal strategies.
Why traders use the TMA Centered Bands Indicator
Price often moves between periods of expansion and retracement.
The TMA Centered Bands helps visualize these movements by showing when price is trading near extreme levels or moving with the dominant trend.
The upper and lower bands can act as dynamic resistance and support zones.
When price reaches these areas, users can monitor whether the market continues in the same direction or shows signs of a reversal.
The middle band is one of the most important parts of the indicator because it provides a quick view of trend direction.
A green middle line suggests bullish momentum, while a red middle line indicates bearish pressure.
This makes the tool useful for traders who prefer visual trend analysis without adding multiple indicators to their charts.
Download This MT4 Indicator for Free
Indicator Chart Setup
The chart display shows three TMA-based bands surrounding price.
The upper band and lower band represent possible extreme price areas, while the center band follows the general market direction.
When the middle band changes to green, it indicates that buyers are gaining control. When it changes to red, selling pressure is increasing.
For example, during an uptrend, price may repeatedly pull back toward the middle or lower band before continuing higher.
These areas can be monitored for possible continuation entries when supported by price action confirmation.
Core Features
- Draws dynamic triangular moving average bands
- Shows overall market trend direction
- Provides potential reversal zones
- Includes upper, middle, and lower bands
- Works across multiple timeframes
- Can be combined with other confirmation tools
Best for
- Identifying trend direction
- Finding pullback entry areas
- Analyzing overextended price movements
- Building trend-following strategies
- Locating possible reversal zones
Best Markets
- EUR/USD and GBP/USD where price trends are often smooth
- Gold (XAU/USD) during strong directional movements
- USD/JPY for longer trend-based setups
- Major indices such as NAS100 and US30
- Liquid forex pairs during active trading sessions
Trading Styles
- Trend-following strategies
- Pullback trading on M15, H1, and H4 charts
- Swing trading using higher timeframe direction
- Intraday trading with confirmation signals
- Reversal setups near extreme band levels
How traders use it
The TMA Centered Bands Indicator can be used in two main ways: trading with the trend or looking for reactions near the outer bands.
For a BUY setup, users can monitor situations where price moves below the lower band and then shows signs of recovery.
A bullish candle pattern combined with a green middle band can provide additional confirmation.
The stop loss can be positioned below the recent swing low, while targets can be based on previous resistance areas.
For a SELL setup, traders can watch when price moves above the upper band and begins losing momentum.
A bearish candle pattern combined with a red middle band can support a short position.
The stop loss can be placed above the recent high.
Practical Trading Example with MA Crossover Indicator
A useful combination is pairing the TMA Centered Bands with the MA Crossover Alert Indicator for MT4.
The MA crossover tool provides directional confirmation using arrows: a white UP arrow represents a BUY trend, while a white DOWN arrow indicates a SELL trend.
A simple strategy is to follow the latest arrow direction and only take TMA signals that match it.
BUY Trade
For example, if the MA Crossover Alert creates a white UP arrow and price pulls back toward the lower TMA band, traders can look for a BUY continuation setup.
The 5-period MA for the short moving average and 200-period MA for the long moving average can be used to identify shorter momentum against the broader trend.
SELL Trade
The opposite applies for SELL trades.
When the latest MA Crossover Alert shows a white DOWN arrow, users can focus on bearish TMA setups and avoid buying against the current direction.
Get Instant Free Access
Indicator Settings
- Period: Defines the moving average period used for calculating the TMA bands. The default value is 50. A higher value creates smoother bands, while a lower value makes the indicator react faster.
- Multiplier: Controls the distance between the bands. The default value is 2.0, which adjusts the space between the upper and lower levels.
- Colors: Allows customization of the band colors displayed on the chart.
- Style: Controls the visual appearance of the lines and how they are presented.
Important Notes
- The TMA Centered Bands should not be considered a guaranteed reversal system.
- Strong trends can continue beyond the outer bands for extended periods.
- Always consider the latest trend direction before taking a signal.
- Combining the indicator with moving averages or price action can improve analysis.
- Proper risk management remains essential when using any trading strategy.









