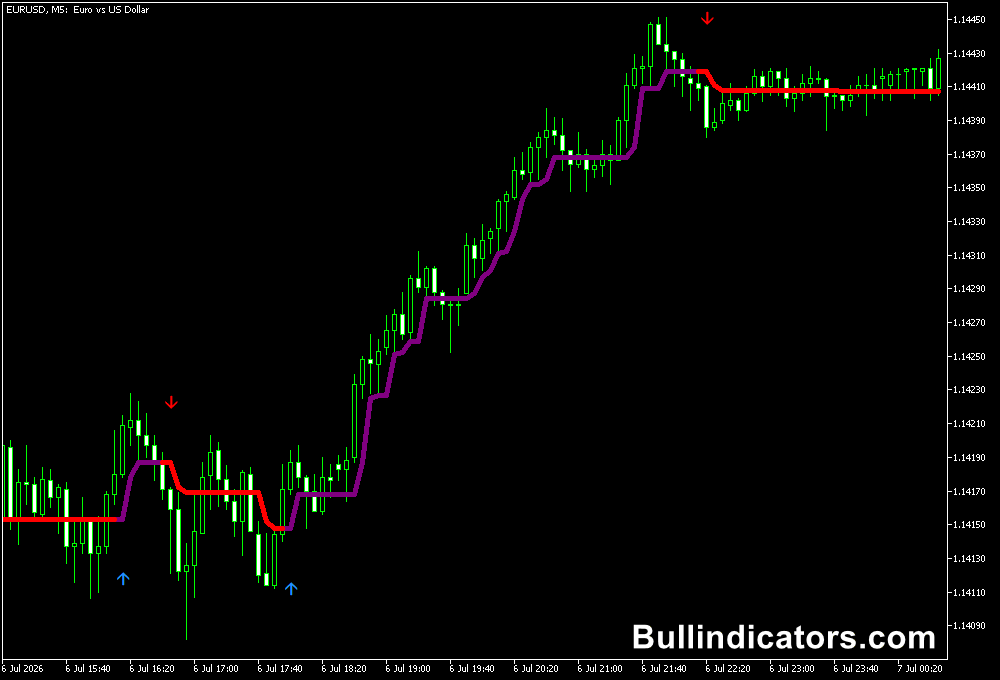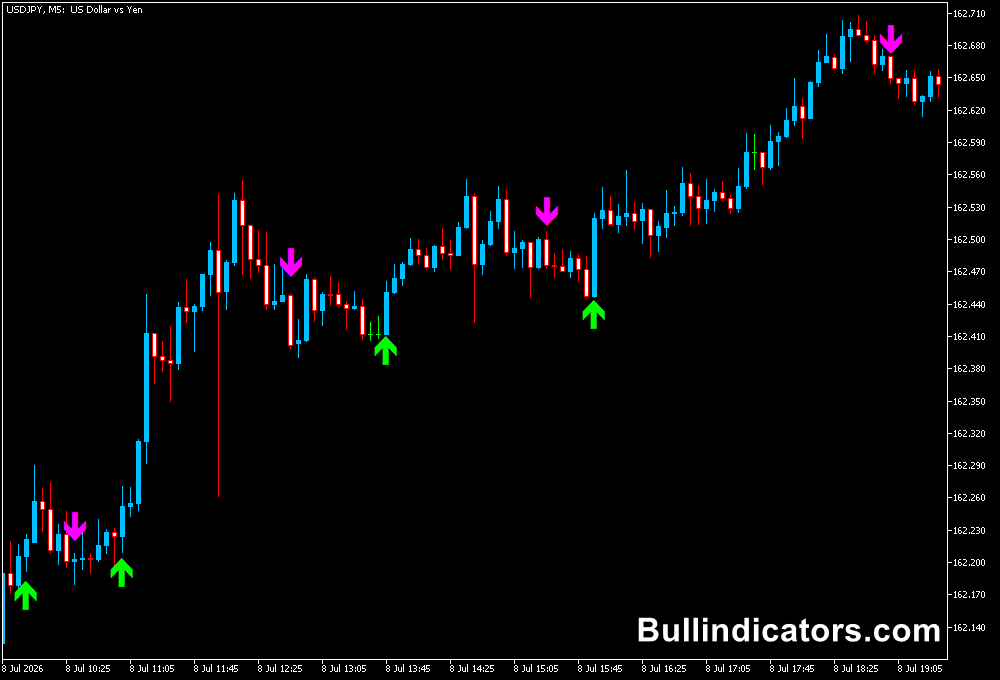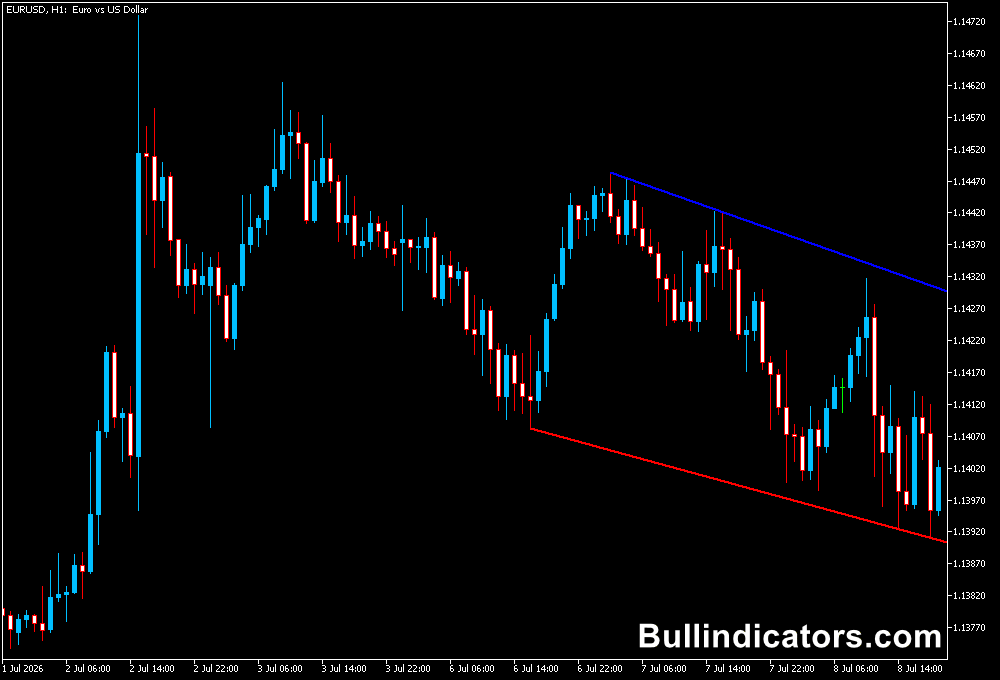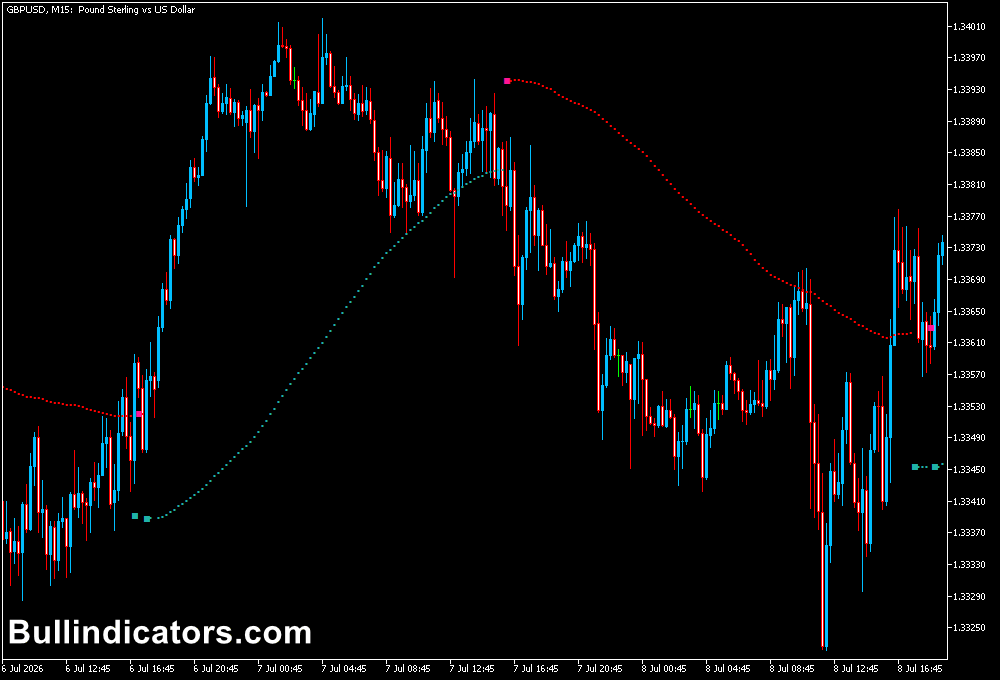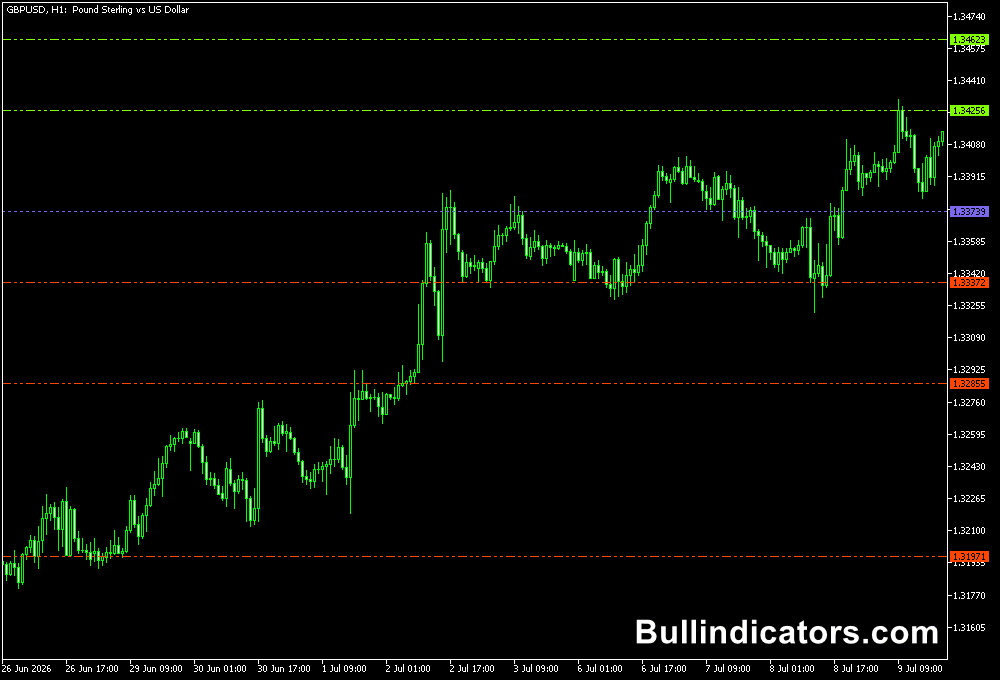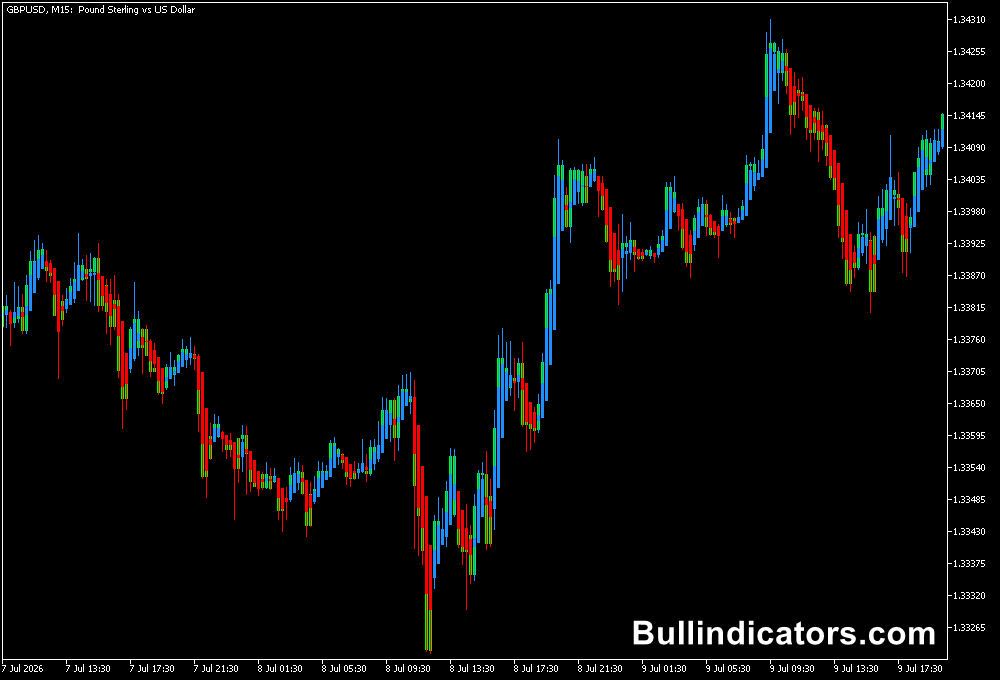
The Intraday Channel Breakout indicator for MT5 identifies the initial trading range of the day and highlights potential breakout opportunities.
It uses a four-hour price range to calculate the channel, marking the highest and lowest prices as its boundaries. A midpoint is also displayed to help assess the market’s directional bias.
The indicator is designed for short-term trading.
It can be used on timeframes from M1 to H4, making it suitable for scalping and intraday strategies.
Its main purpose is to help traders recognise when price moves beyond the initial range and begins developing a stronger directional move.
Why Traders Use the Intraday Channel Breakout Indicator
During the Asian trading session, for example, price may remain within a relatively narrow range before activity increases during the European or US sessions.
The indicator uses this behaviour to establish an intraday reference area.
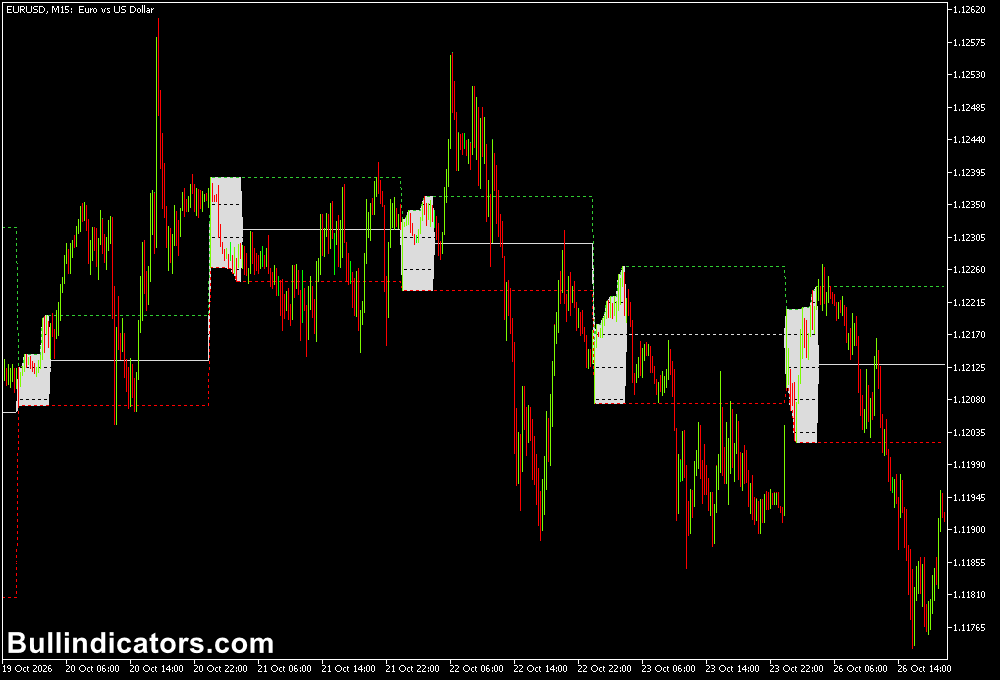
The channel boundaries show the upper and lower limits of the initial range, while the midpoint provides an additional directional reference.
Price trading above the midpoint suggests bullish conditions, whereas movement below it indicates bearish pressure.
A confirmed candle close beyond either channel boundary can then provide a potential breakout entry signal.
Download This MT5 Indicator for Free
Indicator Chart Setup
The Intraday Channel Breakout indicator calculates its channel using a selected start and end time.
During this period, it tracks the highest and lowest prices to establish the upper and lower boundaries. The midpoint separates the range into two sections.
Once the initial channel has been established, traders can monitor price movement relative to these levels.
The area above the midpoint represents the bullish side of the range, while the area below it represents the bearish side.
The indicator is intended for intraday charts rather than daily or higher timeframes.
M5, M15 and M30 charts are useful choices for traders looking for short-term breakout opportunities.
H1 and H4 charts can provide a wider view of the same intraday movement.
Core Features
- Initial four-hour range: Calculates the channel using the selected trading session times.
- Upper channel boundary: Marks the highest price reached during the calculation period.
- Lower channel boundary: Marks the lowest price reached during the calculation period.
- Midpoint level: Divides the channel and helps identify bullish or bearish market conditions.
- Breakout analysis: Helps identify potential entries when a candle closes beyond the channel.
- Adjustable session times: Allows traders to define when channel calculation begins and ends.
Best For
- Identifying breakouts after an initial period of consolidation.
- Monitoring directional changes around the channel midpoint.
- Finding short-term trading opportunities during active market sessions.
- Combining range boundaries with price action confirmation.
Best Markets
The indicator can be used across major Forex pairs, including EURUSD, GBPUSD, USDJPY and AUDUSD. GBPUSD is particularly useful for observing how an Asian-session range develops into a potential London-session breakout.
Traders can also test it on indices, gold and other liquid instruments, adjusting the session times to suit each market.
Trading Styles
Scalpers can monitor M1 and M5 charts for short-term moves beyond the channel.
Day traders may prefer M15 or M30 charts to filter out some of the smaller price fluctuations.
H1 and H4 charts offer a wider perspective for traders who want to assess the direction of an intraday breakout.
How to Trade Channel Breakouts
A bullish setup develops when price moves above the midpoint and eventually breaks through the upper channel boundary.
For confirmation, wait until the breakout candle closes above the upper boundary. This helps distinguish a completed candle breakout from a temporary move beyond the level.
For example, imagine GBPUSD spending the initial trading period moving sideways.
The indicator establishes the upper and lower channel levels.
Price then climbs above the midpoint, showing bullish pressure, before a candle closes above the upper boundary.
This can be considered a potential long entry, with stop-loss placement based on the recent price structure and the trader’s risk limits.
A bearish setup follows the opposite conditions.
Price moves below the midpoint, indicating selling pressure, and then breaks through the lower channel boundary.
A candle close below that level confirms a possible short trade.
For example, if GBPUSD falls below the midpoint and subsequently closes beneath the lower channel boundary, traders can assess a short opportunity.
The recent swing high or another suitable technical level may help determine stop-loss placement.
Not every breakout develops into a sustained trend.
False breaks can occur, particularly during quieter sessions or around important economic announcements.
Checking the broader market direction and avoiding entries based only on a brief price spike can help improve trade selection.
Get Instant Free Access
Indicator Settings
- Start time: Defines when the indicator begins calculating the initial channel.
- End time: Defines when channel plotting ends and the initial range is established.
Important Notes
- The indicator is designed for short-term trading on timeframes from M1 to H4.
- Set the start and end times according to your broker’s server time and the trading session you want to analyse.
- Wait for a candle to close beyond the channel boundary before considering a breakout entry.
- Use appropriate stop-loss and position-sizing rules. Channel breakouts do not guarantee continuation in the breakout direction.