
The Vortex indicator for MT4 is a trend and momentum tool built around two oscillating lines that help identify directional changes in the market.
The V+ line measures bullish movement, while the V- line represents bearish movement.
Their relationship can provide information about the current trend, its strength and possible changes in direction.
The tool can be applied to Forex pairs and other tradable markets across different timeframes.
Its straightforward crossover method makes it suitable for traders looking for a relatively simple way to follow developing trends without placing several calculations directly over the price candles.
Why traders use the Vortex Indicator
The main advantage of the Vortex Indicator is that it combines directional information with a visual measure of momentum.
When the V+ line moves above V-, bullish conditions are developing. When V- moves above V+, bearish pressure is becoming dominant.
The distance between the two lines also provides useful context.
A wide separation can indicate stronger directional momentum, while lines moving close together suggest that the market lacks a strong directional bias.
This distinction can help filter weak crossover signals during sideways conditions.
The crossover itself can be used as an entry or exit trigger, while the position of the lines can help determine whether a trade is aligned with the broader trend.
This makes the Vortex Indicator suitable as a standalone trend reference or as confirmation for a price-action strategy.
Download This MT4 Indicator for Free
Indicator Chart Setup
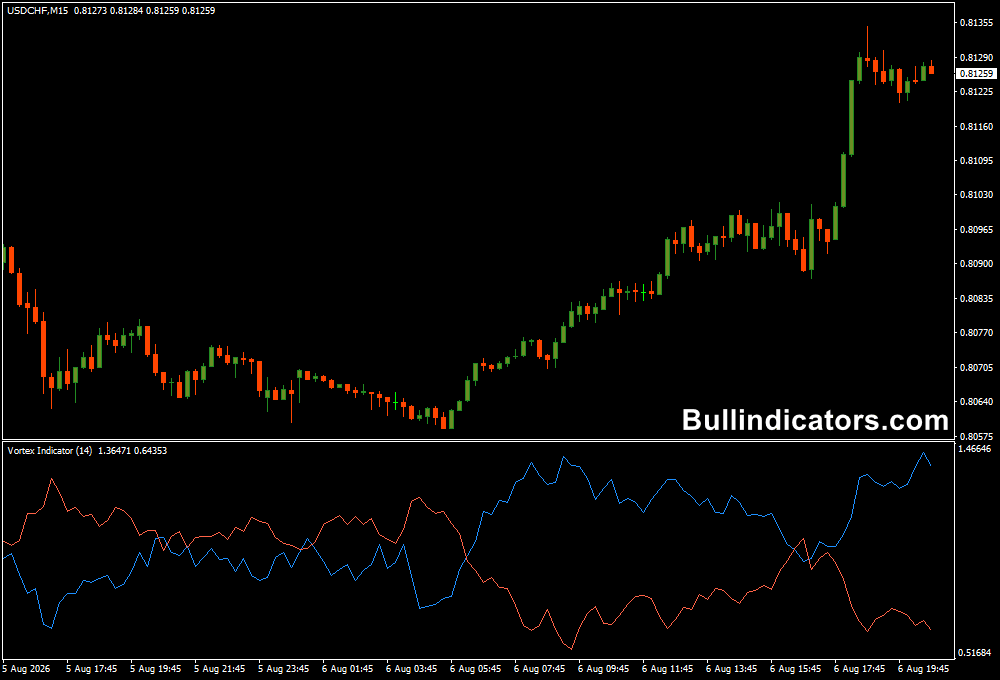
The Vortex Indicator appears in a separate window with two lines.
The V+ line is displayed in dodger blue and represents upward movement, while the V- line is shown in tomato and represents downward movement.
A bullish crossover occurs when V+ moves above V-. A bearish crossover develops when V- moves above V+.
When one line remains clearly above the other and the separation expands, the market is showing stronger directional momentum.
Core Features
- Two-line Vortex calculation for bullish and bearish momentum.
- V+ identifies upward directional movement.
- V- identifies downward directional movement.
- Crossovers provide potential buy and sell signals.
- Line separation helps assess trend strength.
- Works across multiple MT4 timeframes.
- Can be applied to Forex and other liquid markets.
Best for
- Identifying emerging directional trends.
- Following established intraday trends.
- Monitoring momentum through line separation.
- Finding potential reversal and crossover points.
- Confirming trend direction before taking a position.
Best Markets
- GBP/JPY for volatile directional moves, particularly on H1.
- EUR/USD for liquid intraday trend setups.
- GBP/USD when sustained momentum develops during London and New York sessions.
- USD/CAD for slower directional movements on H1 and H4.
- Gold (XAU/USD) can also be tested when strong momentum produces pronounced trends.
Trading Styles
- Intraday trend following on M15 and H1.
- Short-term momentum trading on M5.
- Swing trading on H4 and D1.
- Crossover-based trend strategies.
- Multi-timeframe trend confirmation.
How traders use it
The simplest approach is to monitor which Vortex line is positioned above the other.
When V+ crosses above V-, the market develops a bullish bias and a long setup can be considered.
When V- crosses above V+, the bias turns bearish and a short setup can be evaluated.
Buy Rules
- Wait for the V+ line to cross above the V- line.
- Check that the crossover is supported by bullish price action.
- Prefer buy signals when the broader timeframe is also bullish.
- Look for increasing separation between V+ and V- as additional momentum confirmation.
- Place the stop below a recent swing low or another logical support level.
- Consider exiting when V- crosses back above V+ or when the original trend setup fails.
Sell Rules
- Wait for the V- line to cross above the V+ line.
- Confirm that price action is also showing bearish pressure.
- Give preference to short setups when the higher timeframe trend is bearish.
- Look for expanding separation between the two lines to confirm stronger downside momentum.
- Place the stop above a recent swing high or relevant resistance level.
- Consider exiting when V+ crosses back above V- or the bearish setup becomes invalid.
GBP/JPY Trading Example
For example, on an H1 GBP/JPY chart, a trader may notice V+ moving above V- while price breaks through a previous resistance level.
If the distance between the lines then expands, this provides additional evidence that bullish momentum is strengthening.
The position can be managed while the bullish relationship remains intact.
On a lower M15 chart, the same principle can be used for intraday entries.
A trader can establish the H1 direction first and then wait for an M15 crossover in the same direction.
This helps avoid taking every crossover during periods when the market is moving sideways.
Get Instant Free Access
Indicator Settings
- VI_Length: Sets the calculation period used by the Vortex Indicator.
- A higher value produces fewer signals and can make the tool less responsive to short-term price changes.
- A lower value creates a more responsive calculation and can produce more frequent crossovers.
- The optimal setting can vary between currency pairs and timeframes, so testing is recommended.
Important Notes
- A crossover is not automatically a profitable trade signal, particularly during a sideways market.
- Use the distance between V+ and V- to judge whether momentum is developing or fading.
- Higher VI_Length values may reduce noise but can also delay signals.
- Lower settings can provide earlier signals but may produce more false crossovers.
- Check the broader market direction before taking short-term crossover signals.
- Test different VI_Length values for each market and timeframe rather than assuming one setting works equally well everywhere.









