
The Stochastic Divergence indicator for MT4 automatically identifies divergences between price action and the classic Stochastic oscillator.
Divergence occurs when the highs or lows formed by price do not match the corresponding highs or lows on the oscillator, often revealing a potential change in momentum before it becomes obvious on the chart.
The tool identifies both regular and hidden divergences.
Regular divergence can warn of a possible trend reversal, while hidden divergence can support the continuation of an existing trend.
Signals are displayed with arrows, and the timeframe used for detecting divergence can be adjusted to suit different trading approaches.
Why traders use the Stochastic Divergence Indicator
Manually comparing price swings with oscillator swings can take considerable time, particularly when monitoring several currency pairs.
This tool automates the comparison and highlights potential divergence setups directly on the MT4 chart.
Regular bullish divergence occurs when price forms a lower low while the Stochastic forms a higher low.
This can indicate that bearish momentum is weakening. Regular bearish divergence is the opposite, with price making a higher high while the oscillator makes a lower high.
Hidden divergence has a different purpose.
It can support trend continuation when price makes a higher low during an uptrend or a lower high during a downtrend while the oscillator produces the opposing swing.
The most useful signals generally occur when divergence agrees with the broader market context, such as bullish setups near support or bearish setups around resistance.
Download This MT4 Indicator for Free
Indicator Chart Setup
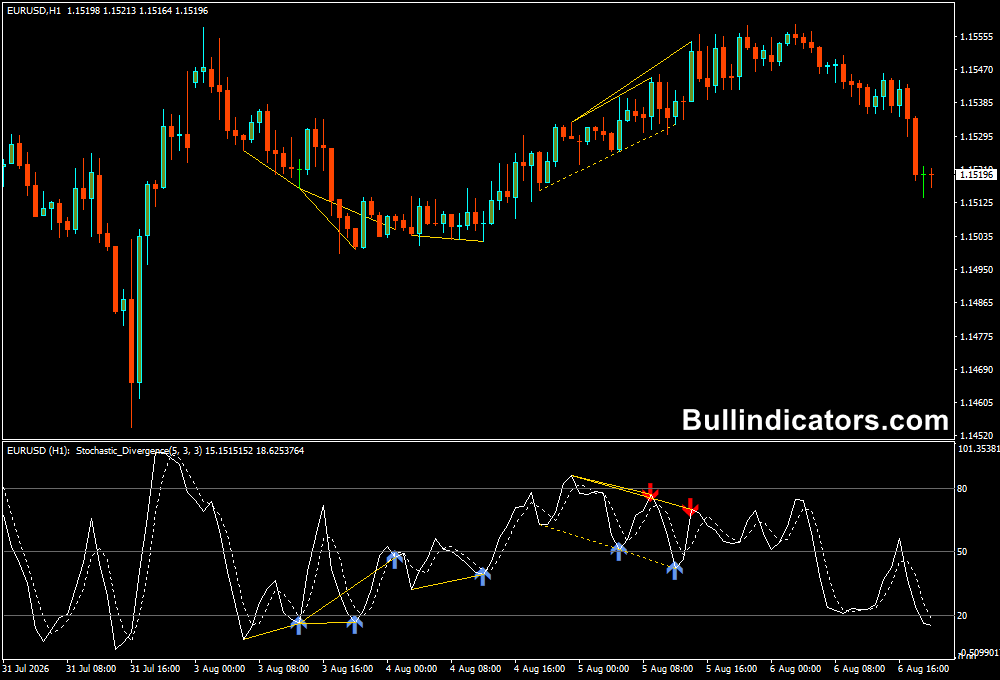
The Stochastic Divergence Indicator identifies divergence between price and the Stochastic oscillator and can mark the relevant swings with trendlines and arrows.
Blue arrows represent bullish signals, while red arrows represent bearish signals.
The tool can also generate notifications through the MT4 Alert window or email, depending on the selected settings.
This is useful when monitoring multiple markets because a potential divergence can be flagged without constantly watching every chart.
Core Features
- Automatically identifies regular and hidden Stochastic divergences.
- Blue arrows highlight potential bullish setups.
- Red arrows highlight potential bearish setups.
- Allows divergence detection on a selected timeframe.
- Can display divergence trendlines on the chart.
- Supports MT4 alerts and email notifications.
- Does not repaint according to the supplied specifications.
- Historical divergence signals can be reviewed on the chart.
Best for
- Identifying potential trend reversal setups.
- Finding continuation opportunities through hidden divergence.
- Confirming price action around support and resistance.
- Multi-timeframe divergence analysis.
- Intraday and swing trading strategies.
Best Markets
- EUR/USD for liquid divergence setups around major technical levels.
- GBP/USD when directional momentum creates pronounced price swings.
- USD/JPY for intraday trend and pullback analysis.
- GBP/JPY for higher-volatility divergence opportunities.
- Gold (XAU/USD) when sharp directional moves create momentum discrepancies.
Trading Styles
- Intraday reversal trading.
- Trend continuation using hidden divergence.
- Support and resistance trading.
- Swing trading on H1 and H4.
- Short-term setups on M5 and M15.
How traders use it
The key is to treat divergence as a setup rather than an automatic entry.
First establish the broader market direction and identify an important technical level.
Then assess whether the Stochastic Divergence signal supports that context.
Buy Rules
- Identify a bullish market or an important support zone.
- Look for price to form a lower low while Stochastic forms a higher low.
- Wait for the blue bullish arrow to appear.
- Confirm that price action supports a potential recovery.
- Enter long after confirmation rather than buying solely because divergence exists.
- Place the stop-loss below the previous swing low.
- Consider taking partial or full profit near resistance or after a bearish counter-signal.
Sell Rules
- Identify a bearish market or an important resistance zone.
- Look for price to form a higher high while Stochastic forms a lower high.
- Wait for the red bearish arrow to appear.
- Confirm that price action supports a potential decline.
- Enter short after confirmation of the bearish setup.
- Place the stop-loss above the previous swing high.
- Consider taking partial or full profit near support or after a bullish counter-signal.
EUR/USD Example
If EUR/USD is trading in a clear bearish trend and rallies into previous resistance, a bearish divergence can provide additional confirmation that the recovery is losing momentum.
A red arrow in this area may offer a short entry opportunity, with the previous swing high providing a logical reference for risk management.
In a bullish market, the process is reversed.
A pullback toward support followed by bullish divergence can indicate that sellers are losing momentum.
A blue arrow can then be used as confirmation for a potential long position.
Get Instant Free Access
Indicator Settings
- KPeriod: Sets the period of the Stochastic %K line, which is the main oscillator line.
- DPeriod: Sets the period of the %D line, which is the moving average of %K.
- Slowing: Controls oscillator smoothing. Increasing this value reduces sensitivity and can filter some market noise.
- drawIndicatorTrendLines: Enables or disables the display of divergence lines on the indicator window.
- drawPriceTrendLines: Enables or disables the display of divergence lines on the price chart.
- displayAlert: Enables or disables notifications in the MT4 Alert window.
- emalAlert: Enables or disables email notifications.
Important Notes
- Divergence does not guarantee that a reversal will occur.
- Give greater weight to sell signals during established bearish markets and buy signals during established bullish markets.
- Bearish divergence near resistance and bullish divergence near support can provide stronger technical context.
- Hidden divergence is generally more useful for identifying potential trend continuation than major reversals.
- Use appropriate stop-loss protection because price can continue moving against a divergence signal.
- Test the Stochastic settings and divergence timeframe to determine which combination suits your market and trading style.









