
The Chaos Semafor indicator for MT5 is a multi-level signal tool based on the classic ZigZag calculation.
It identifies potential bullish and bearish turning points using three signal levels, allowing the analysis to range from frequent short-term signals to more significant market swings.
Each Semafor level uses different periods, with the lower level reacting to smaller price movements and the higher level identifying larger market turns.
This makes the indicator useful for both short-term entries and broader trend analysis.
Why traders use the Chaos Semafor Indicator
The three signal levels provide different perspectives on the same market.
Lower-level signals can help with short-term timing, while higher-level signals can highlight more significant swing points.
This gives the indicator more flexibility than relying on a single signal period.
A useful approach is to use the highest Semafor level together with a higher timeframe to establish the dominant market direction.
Lower-level signals can then be used for entries in that direction.
This reduces the temptation to trade every reversal signal that appears against the broader trend.
The indicator also supports alerts for the different Semafor levels.
Each level can be enabled or disabled according to the trading approach, making the tool suitable for scalping, intraday trading and multi-timeframe analysis.
Download This MT5 Indicator for Free
Indicator Chart Setup
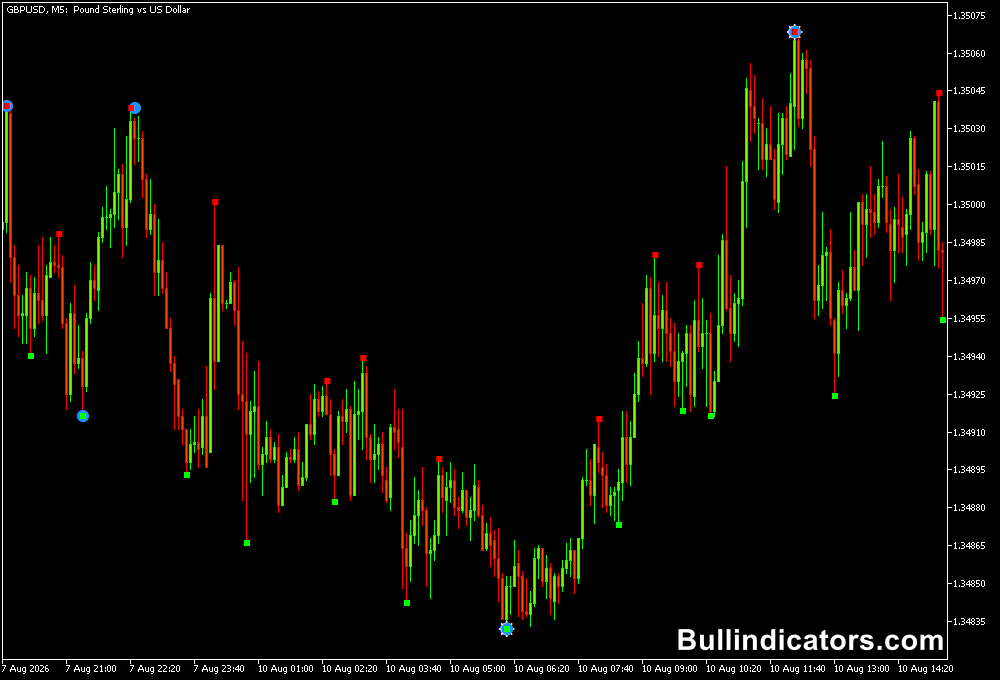
The Chaos Semafor indicator is displayed directly on the MT5 price chart using different colored signals for its three levels.
Level 1 signals are designed to capture smaller price movements, Level 2 represents medium-term swings, and Level 3 identifies larger market turning points.
Signals appearing above price generally indicate bearish conditions, while signals below price indicate bullish conditions.
The highest-level signals can be particularly useful for identifying major swing areas, while the lower levels provide more frequent entry and exit references.
Core Features
- Provides three levels of bullish and bearish signals.
- Uses different periods for low, medium and high Semafor calculations.
- Based on the classic ZigZag calculation.
- Supports alerts for individual Semafor levels.
- Can be used on intraday, daily, weekly and monthly charts.
- Suitable for multi-timeframe trading analysis.
- Allows signal colors and styles to be customized.
Best for
- Identifying potential market turning points.
- Finding short-term entries within a larger trend.
- Mapping significant swing highs and lows.
- Using higher-timeframe direction to filter lower-timeframe signals.
- Building reversal, trend-following and multi-timeframe strategies.
Best Markets
- EURUSD and GBPUSD are well positioned to multi-timeframe Semafor analysis because of their liquidity and frequent intraday movements.
- USDJPY can provide clean directional setups on M15 and H1 charts.
- EURJPY and GBPJPY can generate larger swings that make the three signal levels easier to distinguish.
- Gold can be considered on M15, H1 and H4 when volatility is sufficiently directional.
Trading Styles
- Scalping: M1 and M5 can use Level 1 signals for precise entries, preferably aligned with a higher-timeframe trend.
- Intraday trading: M5 and M15 provide more room for Level 1 and Level 2 signals to develop.
- Swing trading: H1 and H4 can focus on Level 2 and Level 3 turning points.
- Multi-timeframe trading: Use H1 or M15 for directional bias and a lower timeframe for entry timing.
How traders use it
The most effective approach is to establish the dominant trend on a higher timeframe and only take lower-timeframe signals that agree with that direction.
This turns the Semafor levels into an entry-timing tool rather than a system for repeatedly trading every market reversal.
Bullish Setup
- Check the higher timeframe and establish a bullish trend.
- Wait for a bullish Semafor signal below price on the entry timeframe.
- Give preference to signals that appear after a pullback rather than in the middle of an extended move.
- Place the stop loss below the recent swing low.
- Consider taking profit at the next opposite Semafor signal or important resistance level.
Bearish Setup
- Use the higher timeframe to confirm a bearish trend.
- Wait for a bearish Semafor signal above price on the entry timeframe.
- Look for the signal near resistance or following a corrective upward move.
- Place the stop loss above the recent swing high.
- Use the next opposite signal or significant support area as a potential target.
M15 Trend + M1 EURUSD Example
- Trend chart: EURUSD M15.
- Directional filter: If M15 shows a bearish structure and the higher Semafor signals are positioned above price, focus only on SELL opportunities.
- Entry chart: Move to EURUSD M1 and wait for a bearish Level 1 or Level 2 signal after a short upward retracement.
- Confirmation: A bearish candle close or break of the recent M1 swing low can confirm the entry.
- Stop Loss: Above the latest M1 swing high.
- Take Profit: The next M1 support area, an opposite Semafor signal, or a predefined risk-to-reward target.
The same process can be reversed for bullish conditions.
If M15 establishes an upward trend, ignore bearish M1 signals and wait for a bullish Semafor setup to enter in the direction of the larger move.
Get Instant Free Access
Indicator Settings
- Period1: Defines the period used for the low Semafor calculation.
- Period2: Defines the period used for the medium Semafor calculation.
- Period3: Defines the period used for the high Semafor calculation.
- Dev_Step_1: Controls the deviation and step values for the lower-level calculation.
- Dev_Step_2: Controls the deviation and step values for the medium-level calculation.
- Dev_Step_3: Controls the deviation and step values for the higher-level calculation.
- Colors: Controls the colors assigned to the different Semafor signals.
- Style: Controls the visual style of the indicator signals.
Important Notes
- Semafor signals are based on ZigZag-style calculations and should not be treated as guaranteed reversal points.
- Higher-level signals are less frequent and generally represent larger market swings.
- Using the higher timeframe for trend direction can help filter counter-trend signals on lower charts.
- M1 signals can be noisy, so they are best used for precise entries after the broader trend has been established.
- Signals should be evaluated together with price structure, support and resistance and current market conditions.
- Alert levels can be enabled selectively to avoid receiving signals that do not match the chosen trading style.









