
The Vortex indicator for MT5 is a trend-following tool that measures the direction and strength of price movement through two simple lines.
The V+ line represents bullish directional pressure, while the V- line tracks bearish pressure.
Their relationship helps identify developing trends, potential reversals and changes in momentum.
The indicator is suitable for short-term and longer-term analysis, from M1 scalping to H4 trend trading.
Its straightforward crossover signals also make it easy to combine with price action, support and resistance, moving averages or other technical tools.
Why traders use the Vortex Indicator
The main strength of the Vortex Indicator is its ability to show which side of the market has greater directional pressure.
A V+ line above V- indicates that bullish momentum is dominant, while V- above V+ points to bearish conditions.
Crossovers can highlight the start of a new directional move or a possible reversal.
The distance between the two lines also provides useful information about momentum.
When the lines separate significantly, the prevailing trend is generally stronger.
When they remain close together and repeatedly cross, market direction is less established.
This makes the indicator useful for identifying trend continuation opportunities as well as filtering potential entries during weak market conditions.
Download This MT5 Indicator for Free
Indicator Chart Setup
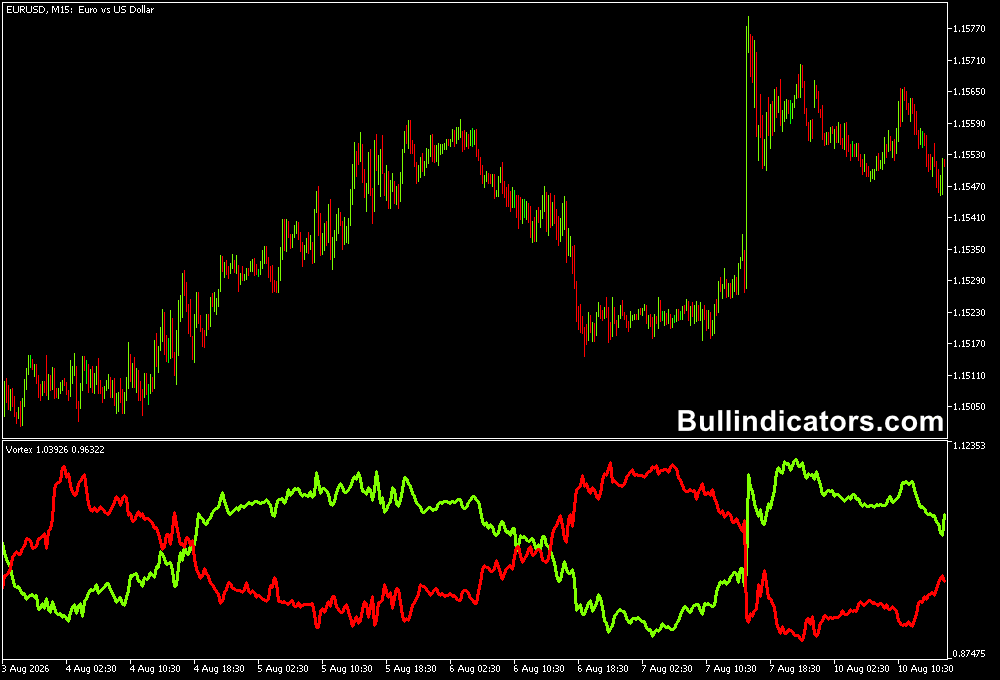
The Vortex Indicator is displayed in a separate window below the main MT5 price chart.
Two lines fluctuate around the indicator’s central area.
The blue V+ line measures upward directional movement, while the red V- line measures downward directional movement.
A bullish signal develops when V+ crosses above V-. A bearish signal occurs when V- crosses above V+.
The strength of the movement can be assessed by looking at how far the two lines move away from each other following a crossover.
Core Features
- V+ and V- lines for measuring bullish and bearish directional movement.
- BUY signals based on bullish V+ and V- crossovers.
- SELL signals based on bearish V- and V+ crossovers.
- Trend-strength information through the separation between the lines.
- Adjustable calculation period through the VI_Length setting.
- Suitable for Forex, commodities and other MT5 trading instruments.
- Can be used on timeframes ranging from M1 to D1.
Best for
- Spotting potential changes from bearish to bullish market direction.
- Following established trends after a confirmed crossover.
- Finding momentum entries after a consolidation period.
- Filtering weak signals when V+ and V- remain tightly compressed.
- Supporting short-term scalping and intraday trend strategies.
Best Markets
- EURUSD: A strong choice for intraday crossover setups during active European and US sessions.
- GBPUSD: Useful for faster M5 and M15 directional movements.
- GBPJPY: Suitable for momentum-based strategies when volatility increases.
- USDJPY: Well suited to H1 trend-following setups with fewer signals.
- XAUUSD: Can be used to monitor strong directional moves during London and New York trading.
Trading Styles
- London scalping: M1 setups on EURUSD or GBPUSD can use a V+ crossover for BUY trades and a V- crossover for SELL trades.
- Intraday momentum: M5 and M15 charts can be used to capture developing moves in GBPJPY, EURUSD and USDJPY.
- Trend following: H1 and H4 provide fewer signals and are better suited to holding positions through larger market swings.
- Reversal trading: Watch for a crossover that contradicts the previous directional move, then seek confirmation from price action.
- Multi-timeframe trading: Use H1 to establish the broader direction and M5 or M15 to search for an entry.
How traders use it
A basic BUY setup occurs when the blue V+ line crosses above the red V- line.
A stronger setup can develop when the crossover occurs after a pullback and price also breaks above a recent swing high.
For SELL trades, look for V- to cross above V+ while price confirms weakness through a break below a recent swing low.
Scalping M1 charts with this indicator
For M1 scalping during the London session, EURUSD and GBPUSD are practical markets to monitor because of their high liquidity during European trading hours.
One approach is to wait for a short pullback after an initial move, then monitor the Vortex lines for a fresh crossover.
A BUY setup requires V+ to move above V- followed by a bullish M1 price confirmation.
For a SELL, wait for V- to move above V+ and then look for bearish price confirmation.
The recent M1 swing can provide a logical location for the stop-loss.
Profit can be taken at a nearby support or resistance level, or the position can be managed while the Vortex lines continue to support the original direction.
Avoid taking repeated crossover signals when both lines are moving sideways and frequently changing position.
For longer-term trading, the same principle can be applied on H1 or H4 charts, with wider stops and targets based on the broader market structure.
Get Instant Free Access
Indicator Settings
- VI_Length: Defines the calculation period of the Vortex Indicator. Lower values make the indicator react faster and can generate more signals, while higher values smooth the calculation and reduce signal frequency.
Important Notes
- Vortex crossovers should be evaluated together with the current price environment.
- M1 scalping produces more signals and requires stricter trade selection.
- Sideways markets can result in repeated crossovers with limited follow-through.
- Higher VI_Length settings can reduce noise but may produce later signals.
- The most suitable setting can differ between currency pairs, commodities and timeframes.
- Risk management remains important even when the indicator shows a strong directional signal.
- You can download the Vortex indicator for MT4 here.









