
The Advanced Fractals indicator for MT5 is a price-action tool designed to identify potential swing points and short-term reversals directly on the chart.
It places colored dots around significant candle highs and lows, helping you recognize areas where buying or selling pressure may be changing.
Fractals are particularly useful because price rarely moves in a perfectly straight line.
Even during a strong trend, markets regularly produce pullbacks and short-term reversals.
Identifying these turning points can help with entry timing, especially when a fractal appears near an important support or resistance level.
The Advanced Fractals indicator can be applied to any timeframe, but its frequent signals make it particularly interesting for scalping and intraday strategies on M1 and M5 charts.
Why traders use the Advanced Fractals Indicator
The indicator provides a simple way to locate potential reversal points without relying on complicated calculations.
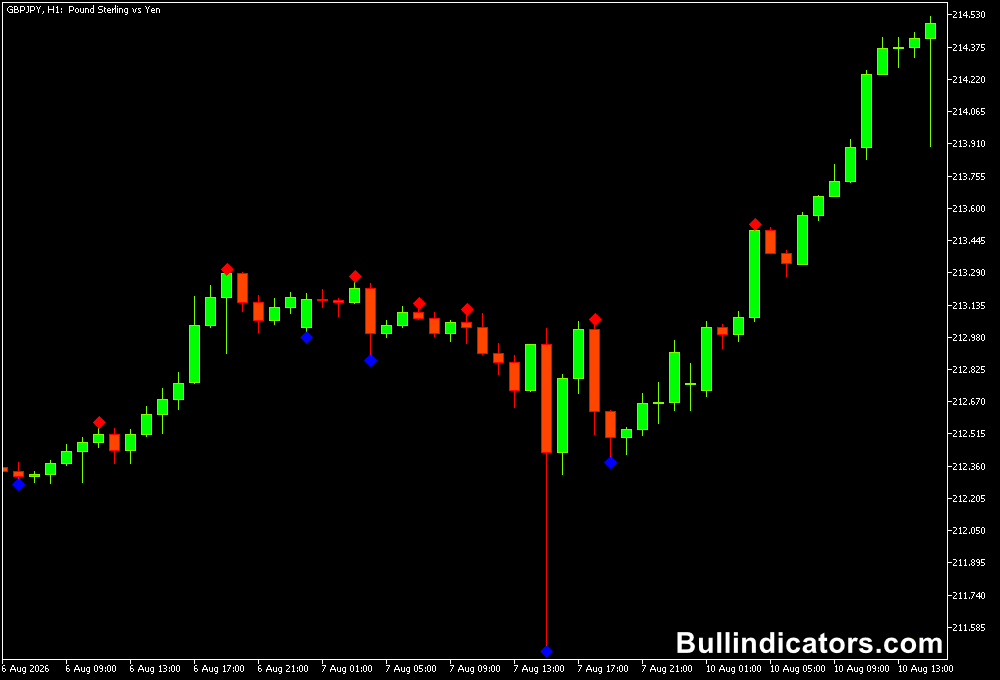
Blue dots below price indicate a potential bullish reversal, while red dots above price indicate a potential bearish reversal.
The strongest use of fractals comes from combining the signals with market context.
A bullish fractal appearing directly above support has more relevance than an isolated bullish dot in the middle of a sideways market.
Similarly, a bearish fractal near resistance can provide a useful warning that upward momentum may be fading.
For scalping, the indicator can also be combined with a momentum-based tool to distinguish a meaningful reversal from a minor fluctuation.
Download This MT5 Indicator for Free
Indicator Chart Setup
The Advanced Fractals indicator displays small colored dots directly around price swings.
Blue dots appear below candles when the indicator identifies a potential bullish reversal point, while red dots appear above candles for potential bearish reversals.
The number and frequency of fractal signals can be adjusted through the Frames setting.
A lower setting can produce more frequent signals, which is useful for short-term charts, while a higher setting can reduce the number of signals and focus more heavily on larger swing movements.
Core Features
- Identifies potential bullish and bearish price reversals.
- Displays blue bullish fractal dots below price.
- Displays red bearish fractal dots above price.
- Adjustable fractal frequency through the Frames setting.
- Works across multiple MT5 timeframes.
- Can be combined with support, resistance and trend indicators.
Best for
- Finding short-term swing reversals.
- Timing entries during pullbacks.
- Identifying potential turning points near support and resistance.
- Filtering scalping entries with a second technical indicator.
- Monitoring intraday price action on M1 and M5 charts.
Best Markets
- EURUSD: Well suited to M1 and M5 scalping because of its liquidity and frequent intraday swings.
- GBPUSD: Useful for faster London-session price movements and short-term reversals.
- GBPJPY: Suitable for aggressive scalping where larger intraday swings can develop quickly.
- Gold (XAUUSD): Useful for identifying short-term turning points during active London and New York sessions.
- US indices: Can be applied to M1 and M5 charts during periods of strong intraday momentum.
Trading Styles
- M1 scalping: Use fractal changes with a fast momentum confirmation for precise entries.
- M5 scalping: Allow the fractal signal to develop around key support or resistance before entering.
- London session trading: Focus on GBP and EUR pairs when liquidity increases.
- New York scalping: Apply the setup to EURUSD, GBPUSD or gold during periods of increased volatility.
How traders use it
A fractal should not be treated as an automatic buy or sell order.
The location of the signal matters.
A bullish dot near support can indicate that sellers are losing control, while a bearish dot near resistance can warn that buyers are struggling to push price higher.
Practical scalping example on M1 and M5 charts
For a more active M1 and M5 strategy, the Advanced Fractals indicator can be combined with the FX Sniper Scalper Indicator for MT5.
The fractal identifies the potential turning point, while the FX Sniper Scalper can be used as the momentum trigger.
A simple trade logic is to watch for the beginning of the colored scalper line after a suitable fractal signal.
The start of a green line can be treated as the bullish trigger, while the beginning of a red line provides the bearish trigger.
- M1 example: EURUSD approaches a previously established support level and prints a blue fractal below price.
- Confirmation: Wait for the FX Sniper Scalper to begin printing its green line.
- Buy trigger: Consider the long entry when the green line begins, provided price remains above the relevant support.
- Stop loss: Place the SL below the recent M1 swing low or fractal low.
- Exit: Consider taking profit at the next resistance level or when the scalper changes to red.
- M5 example: GBPUSD pulls back toward support and produces a blue fractal. If the FX Sniper Scalper subsequently starts a green line, this provides a bullish confirmation for a potential M5 scalp.
- Bearish setup: A red fractal near resistance followed by the beginning of a red FX Sniper Scalper line can provide the opposite setup.
This approach is designed to keep the fractal as the location signal and the scalper indicator as the directional trigger.
It can reduce the number of isolated fractal signals taken during choppy market conditions.
Get Instant Free Access
Indicator Settings
- Frames: Controls the frequency at which fractal signals appear on the Forex chart. Adjusting this setting can help adapt the indicator to faster scalping charts or broader swing analysis.
Important Notes
- A fractal identifies a potential reversal area and should be confirmed before entering a position.
- Signals appearing in the middle of a ranging market can be less useful than those forming at established support or resistance.
- On M1 charts, market noise can generate many fractals, so an additional momentum filter is valuable.
- GBPJPY and gold can move rapidly on lower timeframes, requiring careful position sizing and stop placement.
- The green FX Sniper Scalper line is used as the bullish trigger in the example strategy, while the red line represents the bearish trigger.









