
The ATR Value indicator for MT4 measures the average price movement of a market over a selected number of candles.
It is a volatility tool rather than a trend detector, making it useful for judging whether current market conditions offer enough movement for a particular trading strategy.
A rising ATR value indicates expanding volatility, while a falling reading points to quieter conditions.
This information can be valuable when planning entries, stop-loss distances, take-profit targets, and breakout trades.
The displayed value can also be configured in points or pips, making it easier to relate volatility directly to the chart.
Why traders use the ATR Value Indicator
Price can behave very differently from one session or market period to another.
A fixed 20-pip stop, for example, may be reasonable during a quiet EURUSD session but too tight when GBPJPY is moving aggressively.
The ATR Value Indicator provides a numerical measurement of recent movement, allowing traders to adapt their risk and profit objectives to current volatility.
It can also help identify periods when the market is unusually quiet and potentially preparing for a larger expansion.
Remember that ATR measures movement, not direction. A rising ATR does not mean the market is bullish or bearish.
Use a separate trend or price-action method to determine trade direction.
Download This MT4 Indicator for Free
Indicator Chart Setup
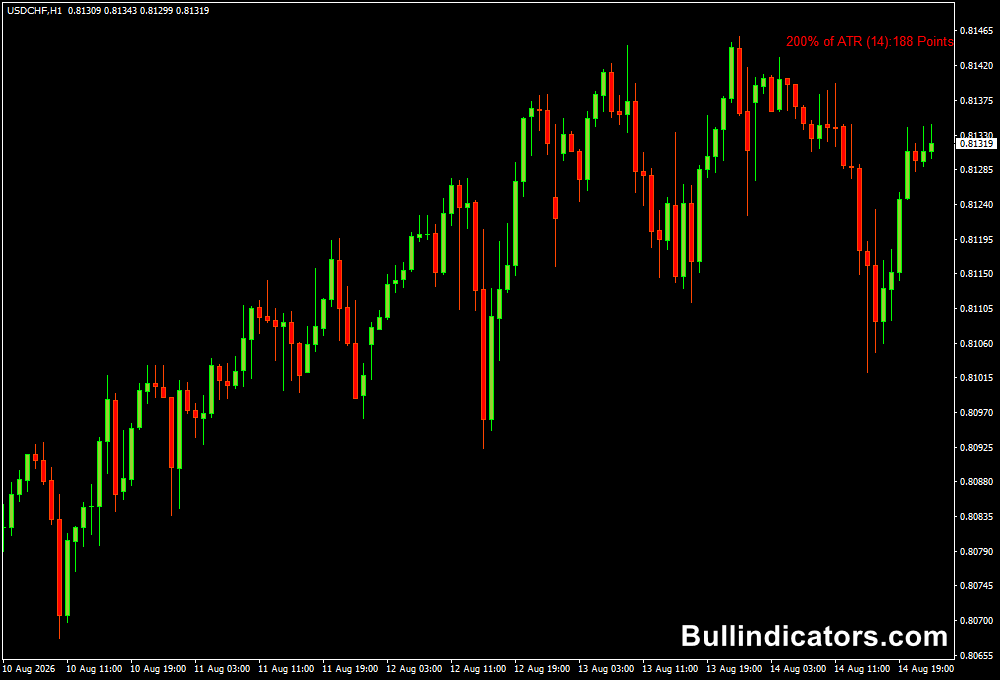
The ATR value is displayed in a separate window and changes as the market’s average trading range expands or contracts.
A higher reading means larger recent price movements, while a lower reading indicates reduced volatility.
The numerical ATR reading can be displayed as points or pips, giving you a practical reference when calculating trade distances.
The value can be monitored across different timeframes to understand the typical movement for that particular chart.
Core Features
- Measures current market volatility.
- Displays the ATR value directly on the MT4 chart.
- Supports customizable ATR calculation periods.
- Can display readings in points or pips.
- Includes an adjustable ATR multiplier.
- Useful for adapting stop-loss and take-profit distances.
Best for
- Determining whether market movement is sufficient for an entry.
- Calculating volatility-based stop losses.
- Setting realistic profit targets.
- Identifying volatility expansions after quiet periods.
- Adapting position management to current market conditions.
Best Markets
- GBPJPY when large intraday ranges create opportunities for volatility-based risk management.
- EURUSD for monitoring changes in London and New York session activity.
- GBPUSD during periods of expanding momentum.
- GBPNZD for markets that regularly produce wider daily ranges.
- XAUUSD when volatility changes rapidly around major market events.
Trading Styles
- Scalping, where ATR can help determine whether a small target is realistic.
- Intraday trading using M15 and H1 volatility readings.
- Breakout trading after prolonged periods of compressed movement.
- Swing trading with H4 and D1 ATR measurements.
- Volatility-based trade management across multiple timeframes.
How traders use it
One practical method is to use ATR as a volatility filter alongside a directional strategy.
For example, a trader can wait for a bullish setup from a trend tool and then check whether ATR is sufficiently active to justify the trade.
Volatility Breakout Example
- Identify a prolonged period of low ATR readings on the H1 or H4 chart.
- Mark the nearest support and resistance boundaries.
- Wait for price to break and close beyond one of these levels.
- Confirm the breakout with your preferred trend or price-action method.
- Check whether ATR is beginning to rise, showing expanding movement.
- Enter in the breakout direction after confirmation.
- Use an ATR multiple to establish a volatility-adjusted stop.
- Target the next major market level or a suitable ATR-based profit distance.
ATR Stop-Loss Example
- Suppose the current ATR reading on GBPUSD is 25 pips.
- Choose a 2x ATR risk distance, giving 50 pips.
- For a buy trade, place the stop approximately 50 pips below the entry.
- For a sell trade, place the stop approximately 50 pips above the entry.
- Adjust the multiplier according to the timeframe, strategy, and market volatility.
The same concept can be used for trailing stops.
As volatility changes, the ATR measurement provides a reference for keeping the stop far enough away from normal price fluctuations while still controlling risk.
Get Instant Free Access
Indicator Settings
- ATR Period: Determines the number of candles used to calculate the average true range. The default value is 14.
- Multiplier: Multiplies the ATR value by the selected factor for volatility-based calculations.
- Display: Determines whether the ATR reading is displayed in points or pips.
- LabelColor: Sets the color used for the displayed ATR value and labels.
Important Notes
- ATR measures volatility and does not determine whether the market is bullish or bearish.
- Use a separate trend or price-action method when determining trade direction.
- Higher ATR readings mean larger average movement, not necessarily better trading conditions.
- Very low ATR readings can indicate compressed markets where breakout conditions may develop.
- Adjust stop-loss distances to the current volatility rather than relying on one fixed number of pips.
- ATR multiples should be adapted to the market, timeframe, and trading strategy.
- Always control position size when using wider volatility-based stops.









