
The Candlestick Pattern indicator for MT4 automatically scans price action and identifies more than 30 recognized candlestick formations.
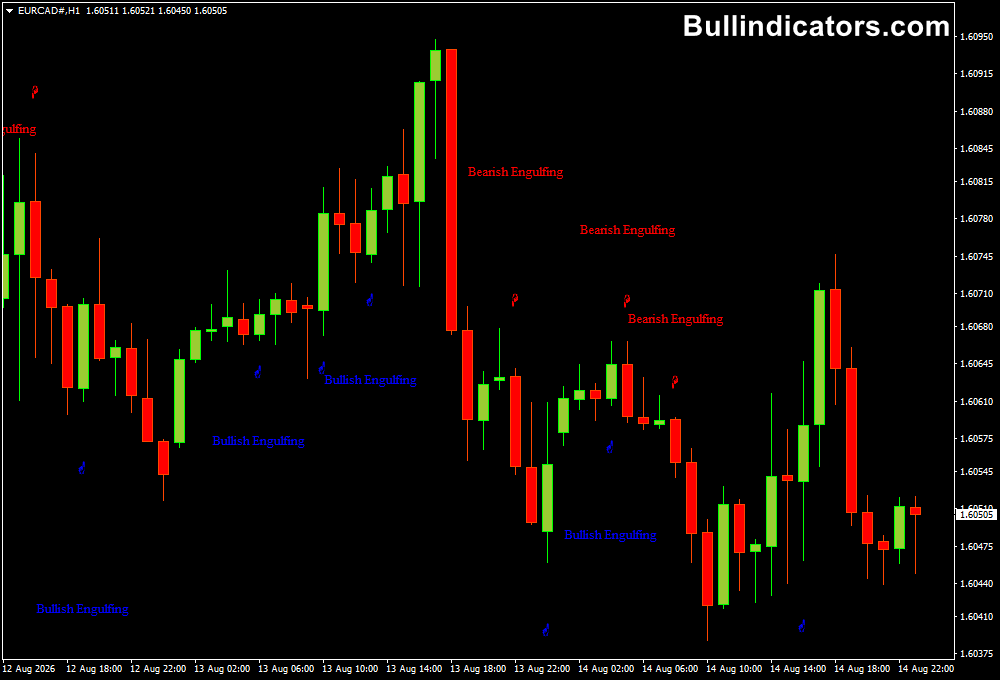
It labels patterns directly on the chart, helping you recognize potential bullish and bearish reversals without having to memorize every formation.
Patterns such as engulfing candles, Harami, piercing lines, dark cloud cover, three black crows, and three white soldiers can provide useful information about changing market sentiment.
The key is to interpret each formation in relation to the current trend, support and resistance, and the location where the pattern appears.
Why traders use the Candlestick Pattern Indicator
Candlestick analysis is especially useful because the formations describe how buyers and sellers behaved during a specific sequence of candles.
A bullish engulfing pattern appearing after a decline can suggest that buying pressure is returning, while a bearish engulfing pattern near resistance can warn that sellers are gaining control.
The main advantage of this tool is pattern recognition.
Rather than manually scanning every candle, it identifies qualifying formations and displays their names on the chart.
Alerts can also be enabled, making it easier to notice new patterns while monitoring several markets.
For better results and the potential to capture more pips, always combine candlestick patterns with a trend indicator.
For example, the Forex Entry Indicator for MT4 uses a blue arrow for a bullish trend and a red arrow for a bearish trend.
This provides a simple way to filter candlestick signals according to the broader market direction.
Download This MT4 Indicator for Free
Indicator Chart Setup
The tool places pattern names directly around the relevant candles on the price chart.
Depending on the formation detected, you may see bullish or bearish patterns such as engulfing formations, Harami, stars, piercing lines, dark cloud cover, and three-candle formations.
You can also choose which formations are displayed.
This is useful when your strategy focuses on a smaller group of patterns rather than every formation available.
Core Features
- Detects more than 30 candlestick formations.
- Identifies both bullish and bearish patterns.
- Labels formations directly on the MT4 chart.
- Supports alerts when new patterns are detected.
- Allows individual candlestick patterns to be enabled or disabled.
- Can be used across different markets and timeframes.
Best for
- Price-action based trading strategies.
- Identifying potential reversals near important levels.
- Confirming entries after pullbacks.
- Learning and recognizing different candlestick formations.
- Combining candle patterns with trend direction.
Best Markets
- GBPJPY for larger intraday swings and strong reversal formations.
- EURUSD for cleaner price action around major support and resistance.
- GBPUSD during London-session momentum.
- USDJPY when candlestick signals develop around Asian and London session levels.
- XAUUSD for traders looking for reversal patterns during high-volatility periods.
Trading Styles
- Scalping on M5 and M15 charts.
- Intraday trading on M15 and H1.
- Swing trading using H4 and D1 formations.
- Pullback trading in established trends.
- Reversal trading around major support and resistance zones.
How traders use it
The strongest approach is to avoid treating every detected pattern as an automatic trade.
First establish the market direction with a trend filter, then wait for a candlestick formation that agrees with that direction or appears at a meaningful reversal area.
GBPJPY Buy Example
- Open GBPJPY on an M15 or H1 chart.
- Use the Forex Entry Indicator to determine the broader direction.
- Wait for the Forex Entry Indicator to display a blue arrow, confirming a bullish trend.
- Allow price to pull back toward support or a previous swing area.
- Look for a bullish engulfing, bullish Harami, piercing line, morning star, or another bullish formation.
- Wait for the bullish pattern to complete and preferably close.
- Enter a buy after the candlestick confirmation.
- Place the stop loss below the recent swing low or support zone.
- Target the previous high, resistance, or the next logical price objective.
GBPJPY Sell Example
- Open GBPJPY on M15 or H1.
- Check the Forex Entry Indicator for a red arrow, confirming a bearish trend.
- Wait for price to retrace toward resistance or a previous swing high.
- Look for a bearish engulfing, dark cloud cover, bearish Harami, shooting star, or three black crows.
- Wait for the bearish formation to complete and close.
- Enter a sell once the pattern confirms renewed selling pressure.
- Place the stop loss above the recent swing high or resistance area.
- Target the previous low, support, or another suitable downside objective.
GBPJPY can produce substantial intraday movements, so the combination of trend direction and candlestick confirmation can help avoid taking reversal patterns against strong momentum.
Always trade in the direction of the main trend when possible and adjust the stop and target to current volatility.
Get Instant Free Access
Indicator Settings
- Show Alert: Enables or disables pattern alerts.
- Display bearish engulfing: Shows or hides bearish engulfing formations.
- Display three outside down: Enables or disables the three outside down pattern.
- Display three inside down: Controls the display of three inside down formations.
- Display dark cloud cover: Enables or disables dark cloud cover.
- Display three black crows: Controls the display of the three black crows pattern.
- Display bullish engulfing: Enables or disables bullish engulfing formations.
- Display three outside up: Controls the three outside up pattern.
- Display three inside up: Enables or disables three inside up formations.
- Display piercing line: Controls the display of piercing line formations.
- Display three white soldiers: Enables or disables three white soldiers.
- Display stars: Controls star-type patterns such as shooting stars.
- Display Harami: Enables or disables bullish and bearish Harami formations.
Important Notes
- Always combine candlestick patterns with a trend indicator for stronger trade filtering.
- A blue Forex Entry arrow indicates bullish direction, while a red arrow indicates bearish direction.
- Do not automatically trade every formation detected on the chart.
- Patterns have greater significance when they appear near established support, resistance, supply, or demand.
- Wait for the relevant candle formation to close before acting on the signal.
- Strong trends can invalidate reversal patterns, so the broader market direction should remain a priority.
- Use appropriate stop-loss placement and risk management for every trade.









