
The Fractals Adjustable Trend Period indicator for MT4 uses fractal points to draw dynamic trendlines directly on the price chart.
These lines can help identify directional conditions while also highlighting areas that may function as support and resistance.
A key advantage is its multi-timeframe capability.
Trendlines calculated from another timeframe can be displayed on the active chart, allowing a trader to see important higher-timeframe levels without constantly switching between charts.
This makes the tool particularly useful for combining broader market direction with more precise lower-timeframe entries.
Why traders use the Fractals Adjustable Trend Period Indicator
Fractal points provide natural swing locations from which trendlines can be constructed.
Once connected, these lines offer a practical reference for identifying bullish and bearish phases, potential breakouts and areas where price may react.
Completed and uncompleted trendlines are displayed separately, making it possible to distinguish established formations from lines that are still developing.
Higher-timeframe trendlines can also give lower-timeframe setups additional context, especially when an entry occurs close to a major trendline or fractal level.
Download This MT4 Indicator for Free
Download “fractals-adjustable-period-trend-lines.ex4” Indicator
Indicator Chart Setup
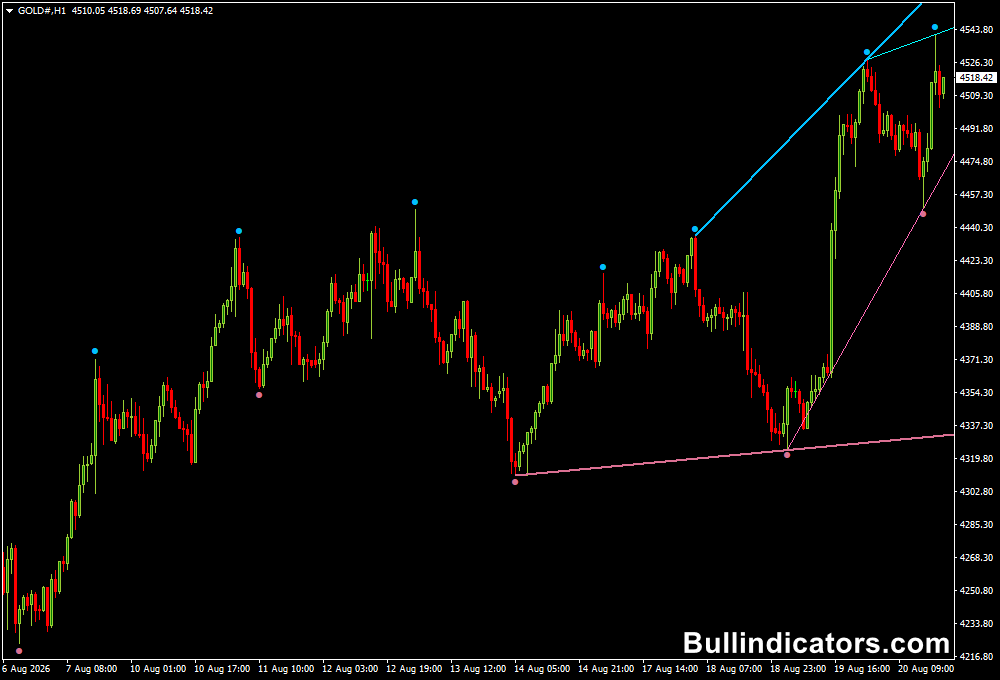
The indicator plots upward and downward trendlines based on the selected fractal period.
Completed bullish trendlines are displayed in Deep Sky Blue, while developing bullish lines use Aqua.
Completed bearish trendlines appear in Pale Violet Red and developing bearish lines in Hot Pink.
The lines can serve as directional references as well as potential support and resistance.
A completed upward trendline can support a bullish bias, while a completed downward trendline can indicate bearish pressure.
Trendlines from another timeframe can also be projected onto the current chart.
Core Features
- Builds trendlines from fractal swing points.
- Supports adjustable fractal calculation periods.
- Displays completed and developing trendlines separately.
- Can project trendlines from other timeframes.
- Highlights potential support and resistance areas.
- Useful for identifying bullish and bearish market phases.
- Suitable for intraday and higher-timeframe analysis.
Best for
- Multi-timeframe trend analysis.
- Trendline breakout strategies.
- Support and resistance trading.
- Finding entries around significant swing points.
- Identifying potential continuation and reversal areas.
Best Markets
- GBPJPY for strong directional swings and well-defined fractal levels.
- EURUSD and USDJPY for structured intraday trendlines.
- GBPUSD during active London and New York sessions.
- Gold (XAUUSD) when price develops clear swing structures.
- US30 and NAS100 for trendline breakout and pullback setups.
Trading Styles
- Multi-timeframe intraday trading.
- Trend-following strategies.
- Breakout trading around established trendlines.
- Pullback entries near fractal support and resistance.
- Swing trading on H4, D1 and higher charts.
How traders use it
A useful method is to display higher-timeframe trendlines on a lower chart.
For example, H4 trendlines can be projected onto an M15 chart.
This allows the broader market structure to remain visible while M15 provides the timing for an entry.
Strategy with Schaff Trend Cycle indicator
For additional confirmation, the Schaff Trend Cycle Indicator for MT4 can be combined with the fractal trendlines.
The oscillator appears in a separate window beneath the price chart with values ranging from 0 to 100.
Reference levels such as 25 and 75 can be used to identify potentially oversold and overbought conditions.
For a bullish setup, traders can wait for price to respect an upward trendline while the Schaff Trend Cycle moves upward from a lower reading.
A bearish setup can develop when price rejects a downward trendline and the oscillator turns lower from an elevated level.
Buy Rules
- Identify a completed bullish trendline or bullish higher-timeframe trend.
- Wait for price to pull back toward the trendline or fractal support.
- Look for bullish price action or a rejection of the support area.
- Confirm that the Schaff Trend Cycle is turning upward, preferably from below 25.
- Enter BUY after bullish momentum is confirmed.
- Place the stop below the recent swing low or supporting fractal.
- Target the next major resistance, opposite trendline or a suitable risk-to-reward level.
Sell Rules
- Identify a completed bearish trendline or bearish higher-timeframe trend.
- Wait for price to retrace toward the trendline or fractal resistance.
- Look for bearish rejection or a confirmed downside reaction.
- Confirm that the Schaff Trend Cycle is turning lower, preferably from above 75.
- Enter SELL once bearish momentum is established.
- Place the stop above the recent swing high or relevant fractal.
- Target the next support, opposite trendline or a predefined risk-to-reward level.
Get Instant Free Access
Download “fractals-adjustable-period-trend-lines.ex4” for MT4
Indicator Settings
- Fractal period: Sets the period used for fractal calculations.
- Upper fractal displacement: Defines the value used to calculate upper displacement.
- Lower fractal displacement: Defines the value used to calculate lower displacement.
- Upper trend line completed color: Controls the color of completed bullish trendlines.
- Upper trend line uncompleted color: Controls the color of developing bullish trendlines.
- Lower trend line completed color: Controls the color of completed bearish trendlines.
- Lower trend line uncompleted color: Controls the color of developing bearish trendlines.
- Completed trend line width: Sets the width of completed trendlines.
Important Notes
- Fractal points require confirmation, so the most recent swing may not immediately become a completed fractal.
- Higher-timeframe trendlines generally carry more weight than those formed on very short charts.
- Developing trendlines should be treated with more caution than completed formations.
- Do not treat every trendline touch as an automatic entry; price action and momentum confirmation remain important.
- The Schaff Trend Cycle can provide additional momentum confirmation but should not be used as the sole reason for entering a trade.
- Trendline behavior can vary considerably between volatile and ranging markets, so stop placement should reflect current market conditions.









