
The TMA MACD Indicator for MT4 combines Triangular Moving Average calculations with MACD to produce trend and momentum signals with a higher-timeframe perspective.
Rather than relying only on the conventional MACD zero-line crossover, this version can use a configurable Hot Level to filter smaller fluctuations and focus attention on more meaningful momentum shifts.
One of its useful characteristics is the ability to calculate MACD values from the next higher timeframe than the chart being traded.
This gives a lower-timeframe chart a broader directional reference, which can be particularly useful for intraday trading and pullback entries.
Why traders use the TMA MACD Indicator
The combination of TMA smoothing and MACD momentum creates a practical trend-following tool for traders who want to reduce some of the noise found on lower timeframes.
Histogram color changes can highlight momentum shifts, while crossover signals around the Hot Level provide additional entry information.
The higher-timeframe calculation is particularly useful when trading short-term charts.
A trader can use the broader trend as a filter and then look for setups on the current timeframe that agree with it.
This can help avoid taking every small MACD fluctuation as a standalone trading opportunity.
Download This MT4 Indicator for Free
Indicator Chart Setup
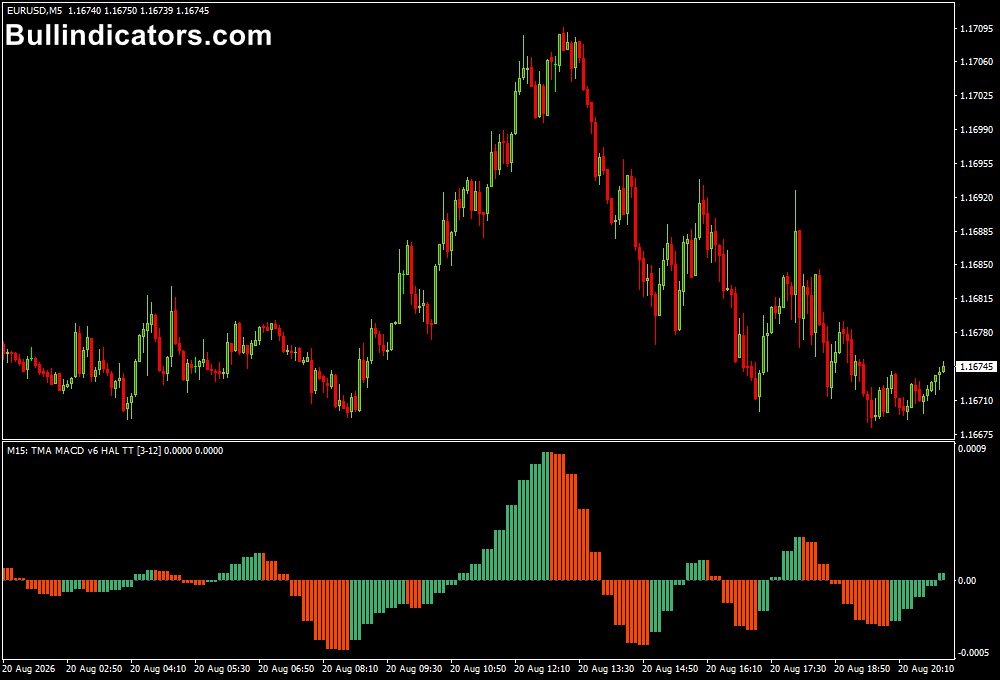
The TMA MACD is displayed in a separate MT4 window and can appear as a line, histogram or tape depending on the Display setting.
The MACD movement is compared with the selected Hot Level, while arrows can be displayed when the MACD crosses this level.
A move above the Hot Level can indicate bullish momentum, while a move below it can indicate bearish conditions.
The timeframe setting can also be configured so that the calculation references a higher timeframe than the active chart.
Core Features
- Combines TMA calculations with MACD.
- Can reference the next higher timeframe automatically.
- Provides bullish and bearish crossover signals.
- Uses configurable Hot Levels to filter weaker movements.
- Displays MACD as a line, histogram or tape.
- Optional BUY and SELL arrows are available.
- Suitable for intraday and higher-timeframe analysis.
Best for
- Following higher-timeframe momentum.
- Trading pullbacks in established trends.
- Filtering weaker MACD crossover signals.
- Intraday trend-following setups.
- Combining momentum confirmation with price action.
Best Markets
- GBPJPY for volatile intraday trend movements.
- EURUSD and GBPUSD for liquid session-based setups.
- USDJPY for directional moves during active trading sessions.
- Gold (XAUUSD) when strong momentum develops.
- NAS100 and US30 for index trend strategies.
Trading Styles
- Intraday trend following on M15 and H1.
- Short-term momentum trading on M5 and M15.
- Pullback trading within established trends.
- Swing setups using H4 and D1 direction.
- Breakout confirmation when momentum moves through the Hot Level.
How traders use it
A useful approach is to allow the higher timeframe to determine the preferred direction, then use the current chart to find an entry.
GBPJPY M15 chart example
For example, on a GBPJPY M15 chart, the indicator can reference the H1 trend automatically.
If the higher-timeframe MACD remains above its Hot Level and the M15 histogram turns bullish after a temporary pullback, a BUY setup can be considered.
For a bearish scenario, traders can wait for the higher-timeframe bias to remain below the Hot Level and then look for bearish momentum to return on M15.
A SELL entry can be considered after the MACD moves back below the relevant level, particularly when price action confirms the continuation.
For GBPJPY M15 specifically, volatility can make the indicator useful for identifying intraday momentum shifts, but position sizing should reflect the pair’s larger average movement.
A stop can be placed beyond the recent M15 swing, while the profit target can be based on the next significant price level or a predefined risk-to-reward ratio.
Get Instant Free Access
Indicator Settings
- TimeFrame: Sets the chart timeframe used by the calculation.
- TimeFrameAuto: Allows the calculation to use a higher timeframe, such as the next timeframe above the active chart.
- FastHalflength: Defines the values used for the Fast TMA calculation.
- SlowHalfLength: Sets the values used for the Slow TMA calculation.
- Price: Selects the candle price values used in the TMA calculation.
- Display: Controls whether the MACD is displayed as a Line, Histogram or Tape.
- HotLevel: Sets the MACD level used for crossover filtering.
- LevelColor: Controls the color of the MACD level line.
- ShowArrows: Displays arrows when MACD crosses the selected Hot Level.
- ARROWBAR: Setting 1 displays the arrow after the signal candle has closed.
- ArrUp: Sets the color of the bullish arrow.
- ArrDN: Sets the color of the bearish arrow.
- ArrGap: Controls the gap between an arrow and its signal candle.
- CodUP: Defines the style of the bullish arrow.
- CodDN: Defines the style of the bearish arrow.
Important Notes
- The Hot Level should be tested for each instrument and timeframe because volatility differs between markets.
- Using the same Hot Level across every currency pair may produce unsuitable signals.
- Ranging markets can generate weaker crossover signals and should be approached cautiously.
- The higher-timeframe calculation is useful for maintaining directional discipline on lower charts.
- Waiting for the signal candle to close can provide a more confirmed entry reference when ARROWBAR is enabled.
- Combining the TMA MACD with support, resistance or price action can provide additional confirmation.









