
The Automatic Trend Lines indicator for MT4 is a powerful technical analysis tool that automatically identifies and draws important trendlines on the MetaTrader 4 chart.
Instead of manually searching for swing points and connecting price movements, the indicator uses an automated calculation method based on Widner’s oscillator to detect relevant trend structures.
Trend lines are an essential part of many forex strategies because they help identify areas where price may continue moving or react.
This tool assists traders by projecting trendlines into the future, creating potential support and resistance zones that can be monitored for breakout and reversal opportunities.
Why traders use the Automatic TrendLines Indicator
Drawing accurate trendlines manually can be subjective, as different traders may connect different highs and lows.
The Automatic Trend Lines Indicator provides a consistent approach by analyzing recent market data and removing outdated or less relevant trendlines automatically.
The main advantage of this tool is its ability to save time while maintaining a clean chart environment.
The projected lines help identify possible breakout points, bounce areas, and locations where price momentum may change.
This indicator is useful for both beginners learning trendline analysis and experienced traders who want an additional confirmation tool.
By combining automated trendlines with price action or other technical methods, traders can create more structured trading decisions.
Download This MT4 Indicator for Free
Indicator Chart Setup
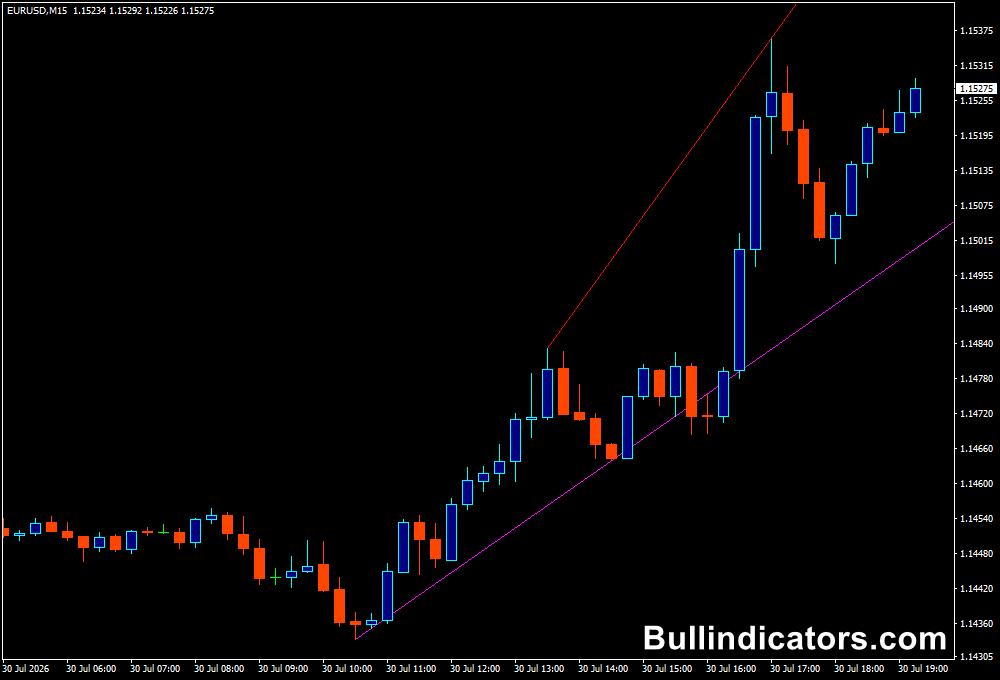
The chart display shows automatically generated upward and downward trendlines based on recent market movements.
These lines extend into future price areas and can act as dynamic support and resistance levels.
Uptrend lines highlight potential buying zones where price may find support, while downtrend lines identify resistance areas where selling pressure could appear.
The indicator removes unnecessary lines to keep the chart focused on the most relevant market levels.
Core Features
- Automatically draws trendlines without manual chart analysis
- Uses Widner’s oscillator for trendline calculations
- Projects trendlines into future price areas
- Removes outdated or unnecessary trendlines automatically
- Helps identify breakout and bounce trading opportunities
- Works with multiple forex pairs and timeframes
Best for
- Trendline breakout strategies
- Support and resistance analysis
- Identifying possible reversal zones
- Learning professional trendline placement methods
- Confirming market direction before entering trades
Best Markets
- EUR/USD and GBP/USD where trend movements often create reliable technical levels
- USD/JPY for identifying extended directional moves
- Gold (XAU/USD) during strong breakout phases
- Major stock indices such as NAS100 and US30 with clear price swings
- Oil and other CFD markets where support and resistance levels are respected
Trading Styles
- Breakout trading after price moves beyond a trendline
- Reversal trading using trendline rejection signals
- Intraday analysis on M15 and H1 charts
- Swing trading with H4 and daily trend structures
- Price action strategies combined with technical confirmation
How traders use it
The Automatic Trend Lines Indicator can be used in several ways depending on the trading approach.
A common method is trendline breakout trading.
When price breaks above a descending trendline, it may indicate increasing buying pressure.
A break below an ascending trendline can suggest weakening bullish momentum.
An example
A trader can combine this tool with the MA Crossover Alert Indicator for MT4 for additional confirmation.
When the Automatic TrendLines Indicator identifies an upward breakout and the MA Crossover Alert Indicator displays a white upward arrow, the two signals can support a potential BUY setup.
For a SELL opportunity, traders can look for price breaking below an upward trendline while the MA Crossover Alert Indicator produces a white downward arrow.
Combining trend direction with moving average momentum confirmation can help filter weaker setups and improve trade accuracy.
In historical testing, combining complementary confirmation tools like trendlines and moving average signals may increase potential pip gains by 40% or more, although results depend on market conditions, risk management, and strategy execution.
Another approach is bounce trading.
If price approaches a trendline and fails to break through, traders can watch for reversal candlestick patterns before entering a position.
Get Instant Free Access
Indicator Settings
- nPeriod: Controls the number of previous candles analyzed to detect trendlines. A higher value allows the indicator to search for larger market movements and broader trend structures, while a lower value focuses on shorter-term price changes.
- Colors: Allows customization of the trendline appearance to match your preferred chart layout.
- Line Style: Adjusts how trendlines are displayed, including visual formatting options for easier chart analysis.
Important Notes
- Automatically generated trendlines should be confirmed with price action before entering trades.
- Strong breakouts are usually supported by momentum and increased market participation.
- Sideways markets can produce weaker trendline signals due to frequent false breaks.
- Higher timeframes generally provide more reliable trendline levels.
- The indicator works best when combined with a complete trading strategy and proper risk management.









