
The Advanced Trendlines indicator for MT4 automatically identifies significant highs and lows and connects them with trendlines.
This makes it easier to follow developing market direction, recognize support and resistance, and spot potential breakout areas without having to draw every line manually.
Trendlines can be particularly useful when trading directional markets because they show how price is progressing from one swing point to another.
The indicator can also help reveal formations such as wedges, triangles and pennants, giving you additional information when planning an entry or managing an existing position.
Why traders use the Advanced Trendlines Indicator
The main advantage of this tool is its ability to keep trendlines updated as the market develops.
Resistance lines are drawn from relevant highs, while support lines connect important lows.
The resulting lines can be used to judge whether price is respecting a trend or approaching a possible breakout.
It is useful across different trading approaches.
Short-term traders can monitor M5 or M15 charts for intraday setups, while swing traders can move to H1, H4 or Daily charts to focus on broader market movements.
Download This MT4 Indicator for Free
Indicator Chart Setup
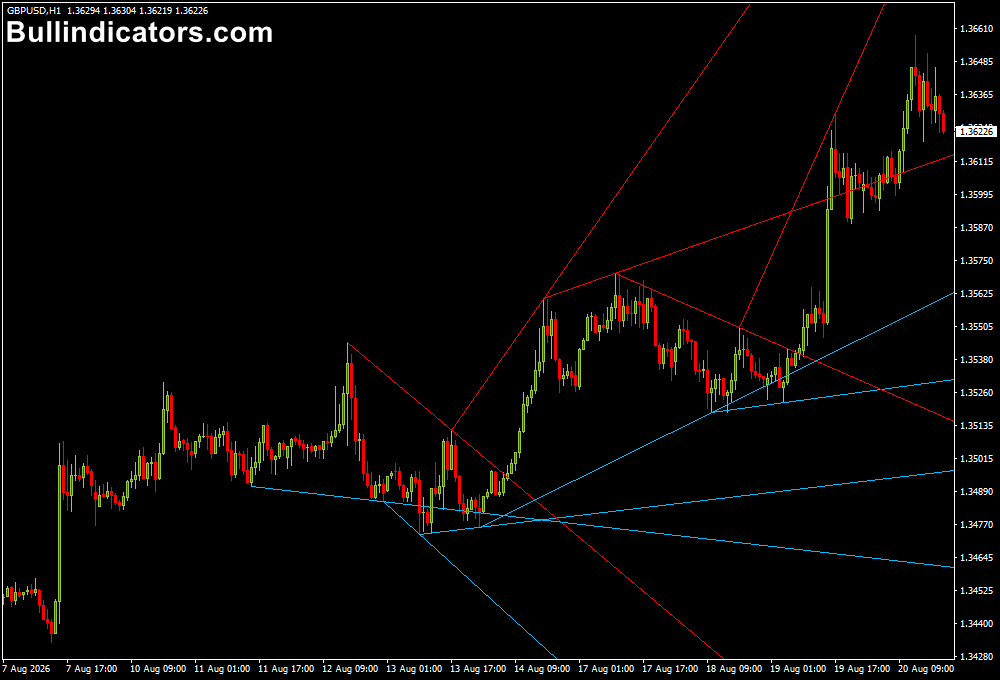
Once running on a MetaTrader 4 chart, the Advanced Trendlines Indicator places lines between relevant swing points.
Red lines represent resistance-related highs, while deep sky-blue lines identify support-related lows.
Depending on the market, several lines may appear and reveal the direction of successive highs and lows.
A sequence of higher highs and higher lows supports a bullish market view.
Lower highs and lower lows point toward bearish pressure.
The lines can also make developing formations easier to recognize, including rising and falling wedges, ascending triangles, descending triangles and symmetrical triangles.
Core Features
- Automatically identifies significant highs and lows.
- Draws support and resistance trendlines.
- Helps identify developing market trends.
- Can highlight potential breakout locations.
- Useful for recognizing wedges, triangles and other formations.
- Supports multiple MetaTrader 4 timeframes.
- Includes alert functionality for changing market conditions.
Best for
- Trend-following setups based on higher highs or lower lows.
- Trendline breakout strategies.
- Support and resistance analysis.
- Identifying developing chart formations.
- Confirming price action before entering a position.
Best Markets
- EURUSD and GBPUSD for liquid intraday trend setups.
- USDJPY for clean directional movements on M5 through H1.
- GBPJPY when larger intraday swings provide stronger trendline breaks.
- Gold (XAUUSD) when volatility creates pronounced swing highs and lows.
- Major indices can also be monitored when the broker provides them through MT4.
Trading Styles
- Scalping on M5 and M15 using short-term trendline breaks.
- Day trading on M15 and H1 around established support and resistance.
- Breakout trading when price closes beyond a well-defined trendline.
- Swing trading on H4 and Daily charts.
- Price action trading combined with candlestick confirmation.
How traders use it
A practical approach is to first determine whether the chart is producing higher highs and higher lows or lower highs and lower lows.
Once a meaningful trendline is visible, wait for price to interact with the line before looking for a trading opportunity.
Buy and sell
For a bullish setup, price can return to an ascending support line and form a bullish candlestick pattern.
A BUY entry can then be considered above the confirmation candle, with the stop below the recent swing low.
The next resistance area or a previous high can provide a logical profit objective.
For a bearish setup, look for price to approach descending resistance and reject the line.
A SELL position can be considered after bearish confirmation, with the protective stop above the recent swing high. The next support level can serve as a potential target.
For breakout trading, wait for a candle to close beyond the trendline rather than reacting to a brief intrabar move.
This helps reduce entries caused by temporary price spikes. Combining the breakout with momentum, volume or a higher-timeframe trend can provide additional confirmation.
Get Instant Free Access
Indicator Settings
- TPeriod: Defines the trend calculation period.
- Tlimit: Sets the trend limit used by the calculation.
- Autoadjust: Allows the trendlines to adjust automatically as new market information develops.
- Auto Timeframe: Selects the timeframe used automatically for the trend analysis.
- Horizontal Lines: Controls the horizontal line display.
- Support: Sets the color used for support trendlines.
- Resistance: Sets the color used for resistance trendlines.
- Alerts: Enables available notifications when relevant trend conditions occur.
Important Notes
- A trendline becomes more meaningful when price has respected it several times.
- Higher-timeframe trendlines generally carry more weight than very short-term lines.
- Do not treat every trendline break as a valid trade; false breakouts can occur during volatile sessions.
- Use recent swing highs and lows when determining protective stop placement.
- Candlestick confirmation and broader market direction can improve the quality of trendline setups.
- Test the settings and strategy on a demo account before applying them to live trading.









