
The Fibonacci Pivot indicator for MT4 combines traditional pivot calculations with Fibonacci ratios to establish important intraday support and resistance levels.
It automatically calculates the central pivot together with three resistance levels and three support levels, giving day traders predefined areas to watch throughout the trading session.
Because the calculations use the previous day’s high, low, and close, the levels are ready for the new trading day and can be used to plan potential entries, stop losses, and multiple profit targets.
The 38.2%, 61.8%, and 76.4% Fibonacci ratios create progressively wider price zones as the market moves away from the central pivot.
Why traders use the Fibonacci Pivot Indicator
Day trading requires knowing where price may encounter support or resistance.
Fibonacci pivots provide a set of objective levels that can be monitored without having to calculate them manually.
The central pivot can also help establish the intraday bias.
When price holds above the pivot, bullish setups may receive greater attention. Sustained trading below the pivot can favor bearish opportunities.
Another advantage is the multiple-target approach. R1, R2, and R3 can be used as successive profit objectives for BUY positions, while S1, S2, and S3 provide corresponding levels for SELL trades.
This makes the tool useful for both fixed-target strategies and trades where profits are gradually secured as momentum develops.
Download This MT4 Indicator for Free
Indicator Chart Setup
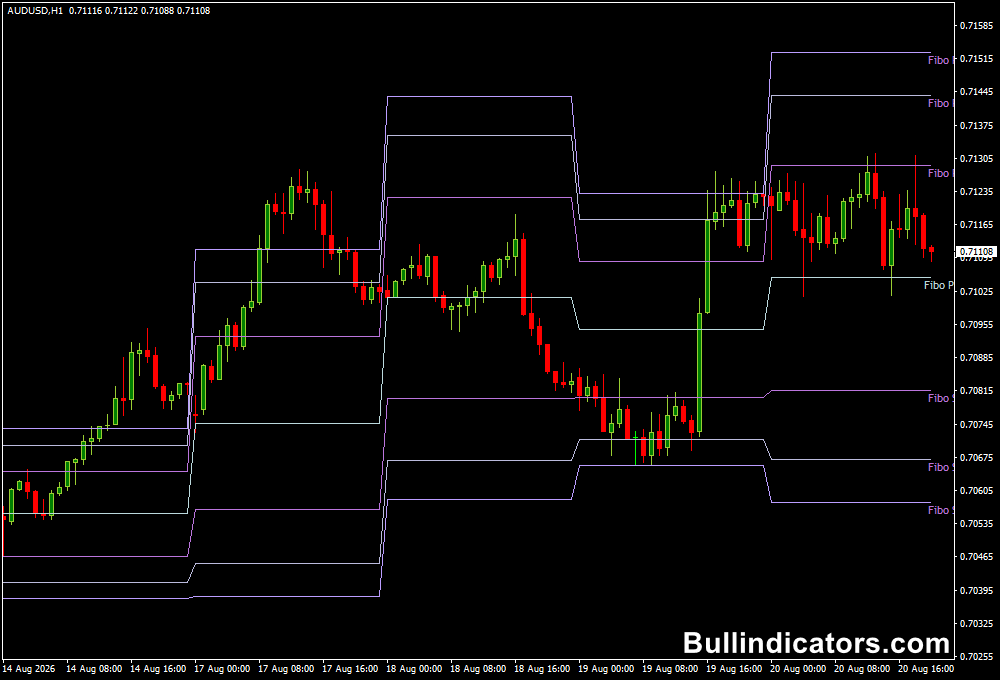
The indicator displays the daily pivot together with Fibonacci-based support and resistance levels across the price chart.
These levels create a roadmap for the trading session, showing where price may pause, reverse, or continue through an important zone.
The pivot is calculated from the previous day’s high, low, and closing price.
The support and resistance distances are then derived using Fibonacci ratios of the previous day’s trading range.
For day trading, M5, M15, and H1 charts are particularly practical.
The M5 chart can be used for precise entries, while H1 can provide additional context regarding the broader intraday direction.
Core Features
- Calculates the daily Fibonacci pivot automatically.
- Displays three resistance levels and three support levels.
- Uses 38.2%, 61.8%, and 76.4% Fibonacci ratios.
- Provides potential areas for entries, stops, and profit targets.
- Supports multiple take-profit objectives.
- Can be used on lower intraday timeframes.
- Allows historical pivot levels to be displayed.
Best for
- Day trading and intraday support/resistance analysis.
- Planning trades around the daily pivot.
- Setting multiple take-profit levels.
- Trailing profitable positions through successive pivot levels.
- Finding potential reversal areas during active sessions.
Best Markets
- USDJPY for M5 day trading and session-based setups.
- EURUSD for liquid European and US session opportunities.
- GBPUSD when stronger intraday volatility is present.
- EURJPY for directional moves between pivot levels.
- XAUUSD for traders comfortable with larger intraday ranges.
Trading Styles
- M5 scalping around S1, S2, R1, and R2.
- M15 intraday trend trading.
- H1 day trading with pivot-based targets.
- Breakout trading through major pivot levels.
- Reversal strategies at Fibonacci support and resistance.
How traders use it
The Fibonacci Pivot Indicator works particularly well for day trading because the levels are calculated from the previous trading day and provide a fresh reference map for the current session.
A common approach is to first determine whether price is trading above or below the central pivot.
Confirmation can then come from price action, momentum, a moving average, or another technical tool.
USDJPY M5 BUY Example
- Open the USDJPY M5 chart during an active London or New York session.
- Price holds above the daily pivot and begins forming higher intraday lows.
- A bullish M5 candle confirms renewed buying pressure near the pivot or S1.
- Consider a BUY entry after the confirmation candle closes.
- Place the stop below the recent M5 swing low or below S1, depending on the setup.
- Use R1 as the first profit objective.
- If momentum remains strong, move the stop toward breakeven and target R2.
- R3 can serve as a final objective during a strong directional session.
USDJPY M5 SELL Example
- USDJPY trades below the daily pivot and sellers maintain control.
- Price retraces toward the pivot or R1.
- A bearish M5 candle rejects the level and closes lower.
- Consider a SELL entry after confirmation.
- Place the stop above the recent M5 swing high or the relevant resistance level.
- Use S1 as the initial profit target.
- If price breaks through S1 with strong momentum, S2 becomes the next objective.
- S3 can be monitored when USDJPY develops an unusually strong bearish session.
A useful management technique is to secure partial profits at the first target and trail the remaining position toward the next level.
This allows a strong trend to continue working while reducing the amount of open risk.
Get Instant Free Access
Indicator Settings
- StartHour – Defines the starting hour used for the pivot calculation.
- StartMinute – Sets the starting minute for the pivot calculation.
- HistoryDays – Determines how many previous days of pivot levels are displayed.
- SupportLabelColor – Sets the color of the support price labels.
- ResistanceLabelColor – Controls the color used for resistance price labels.
Important Notes
- The pivot levels are calculated from previous-day data and do not predict future price movement.
- A move above the pivot does not automatically mean price will continue higher.
- Use candle behavior and market momentum to confirm reactions at the levels.
- When several Fibonacci levels are close together, treat the area as a zone rather than an exact price.
- For M5 day trading, account for spread and short-term volatility when selecting stop distances.
- Partial profit-taking can be combined with trailing stops when price moves strongly between pivot levels.
- Always control position size according to the distance between the entry and stop loss.









