
The DAT MACD indicator for MT4 is a momentum and trend-following tool that combines fast and slow moving averages with a smoothed calculation based on the triple exponential average (TRIX).
By reducing some of the market noise, it helps highlight changes in momentum and potential shifts in direction.
The indicator uses two moving-average lines that move around a zero line.
Crossovers between the lines can provide potential entry and exit points, while their position relative to zero helps assess whether bullish or bearish momentum is dominating the market.
Why traders use the DAT MACD Indicator
The DAT MACD is useful for identifying developing trends without relying solely on raw price movement.
The combination of moving-average crossovers and the zero line gives traders two different ways to assess market direction.
Positive readings generally indicate strengthening bullish momentum, while negative readings point toward increasing bearish pressure.
The smoothed calculation can also make trend movements easier to follow during active market conditions.
It can be used across different currency pairs and timeframes, making it suitable for both short-term setups and longer-term trend analysis.
Download This MT4 Indicator for Free
Indicator Chart Setup
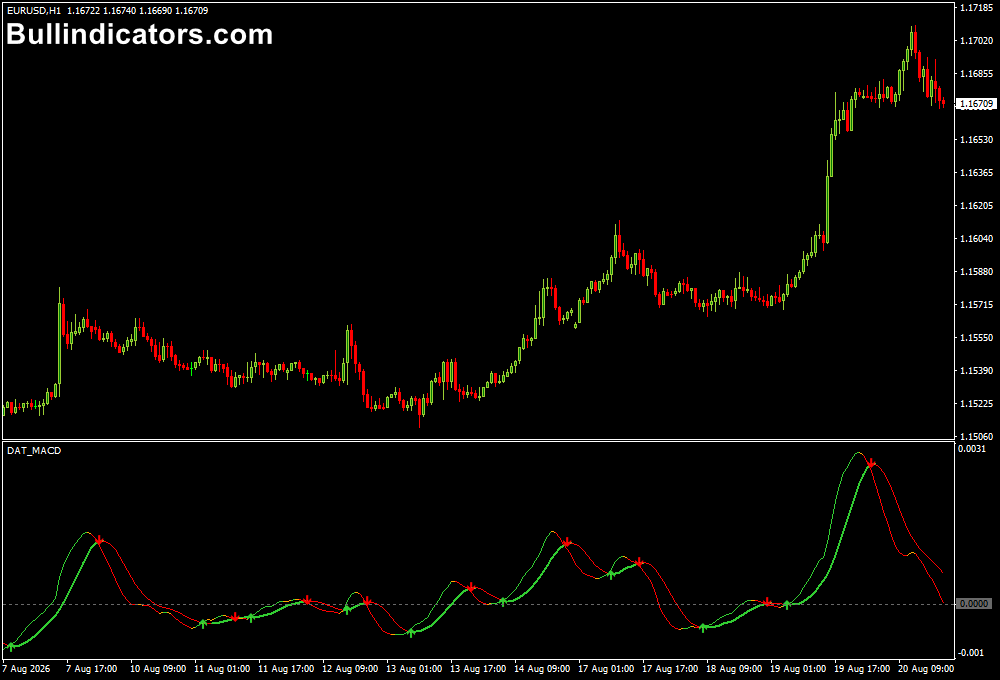
The DAT MACD appears in a separate window below the main MT4 price chart.
Two moving-average lines oscillate around a central zero level and change their position as market momentum develops.
A bullish setup occurs when the faster line moves above the slower line and the readings push above zero.
Bearish conditions develop when the faster line drops below the slower line and the indicator moves beneath zero.
Core Features
- Combines fast and slow moving-average calculations.
- Uses a triple exponential average to smooth market movements.
- Displays momentum above and below the zero line.
- Highlights bullish and bearish moving-average crossovers.
- Can be used for trend-following and reversal analysis.
- Includes divergence-related settings for additional market analysis.
Best for
- Identifying emerging bullish and bearish trends.
- Confirming momentum before entering a position.
- Using moving-average crossovers as trade triggers.
- Filtering potential setups with the zero-line position.
- Monitoring momentum changes during intraday trading.
Best Markets
- EURUSD: Well suited to intraday trend analysis on M15 and H1 charts.
- GBPJPY: Useful for following stronger momentum movements on M5 and M15.
- AUDCAD: A suitable market for studying crossover and momentum signals.
- Gold: Can be applied to XAUUSD when momentum expands during active sessions.
Trading Styles
- Intraday trend trading on M15 and H1.
- Scalping on M5 when momentum is strong.
- Swing trading on H4 and D1 charts.
- Momentum-based entries around moving-average crossovers.
- Trend confirmation alongside price action or support and resistance.
How traders use it
A straightforward approach is to monitor the relationship between the fast and slow lines together with the zero level.
For a potential long setup, the faster line should cross above the slower line while the DAT MACD moves into positive territory.
Stronger confirmation can come when price is also making higher highs and higher lows.
For a potential short setup, look for the faster line to cross beneath the slower line while the indicator moves below zero.
A declining price structure can provide additional confirmation.
AUDCAD trading example
For example, on an AUDCAD chart, a bearish crossover followed by a move below zero can indicate that selling momentum is gaining strength.
Conversely, a bullish crossover combined with a move above zero can support a long bias.
Positions can be managed using recent swing highs and lows, support and resistance, or a predefined risk-to-reward ratio.
The indicator works particularly well as a confirmation tool rather than being used in isolation.
Get Instant Free Access
Indicator Settings
- Fast period: Controls the calculation period of the faster moving average.
- Slow period: Sets the period used for the slower moving average.
- Signal period: Determines the signal calculation period.
- Method selection: Allows different moving-average calculation methods.
- Method type: Selects the moving-average method used by the calculation.
- Price selection: Determines which price data is used.
- Price type: Defines the selected price input for the calculation.
- Show Trix: Enables or disables the triple exponential average component.
- Trix fast period: Sets the faster TRIX calculation period.
- Trix slow period: Controls the slower TRIX calculation.
- Number of divergence bars: Determines the number of bars considered when identifying divergence.
Important Notes
- A crossover is more meaningful when it agrees with the broader price trend.
- Signals around the zero line can become less reliable during sideways markets.
- Higher timeframes generally produce fewer but more significant momentum signals.
- For scalping, M5 and M15 charts can provide more frequent setups but also more market noise.
- Consider price action, support and resistance, and market conditions before entering a position.
- Always use appropriate risk management because no indicator can guarantee profitable trades.









