
The Multi Time Frame indicator for MT4 combines three different chart periods into one compact display, allowing you to study the broader direction of a currency pair without constantly switching between charts.
The default configuration presents the weekly, daily, and H4 timeframes, giving a top-down view of long-term momentum, intermediate movement, and shorter-term confirmation.
This approach is useful when a setup on a lower timeframe needs confirmation from the larger market picture.
By comparing three periods at the same time, you can assess whether momentum is aligned or whether price is moving against the dominant direction.
Why traders use the Multi Time Frame Indicator
Many Forex setups look attractive on a single chart but become less convincing when viewed against a higher timeframe.
This MT4 tool helps solve that problem by bringing multiple perspectives together in one display.
The weekly timeframe can be used to establish the dominant direction, while the daily chart provides an intermediate view of price development.
The H4 timeframe then offers a closer look for potential entries and exits. This combination can make top-down analysis faster and help filter trades that conflict with the broader market trend.
The three-period approach can also be adapted to different trading approaches.
A scalper may prefer shorter combinations such as M30, M5, and M1, while swing traders can work with W1, D1, and H4.
Download This MT4 Indicator for Free
Indicator Chart Setup
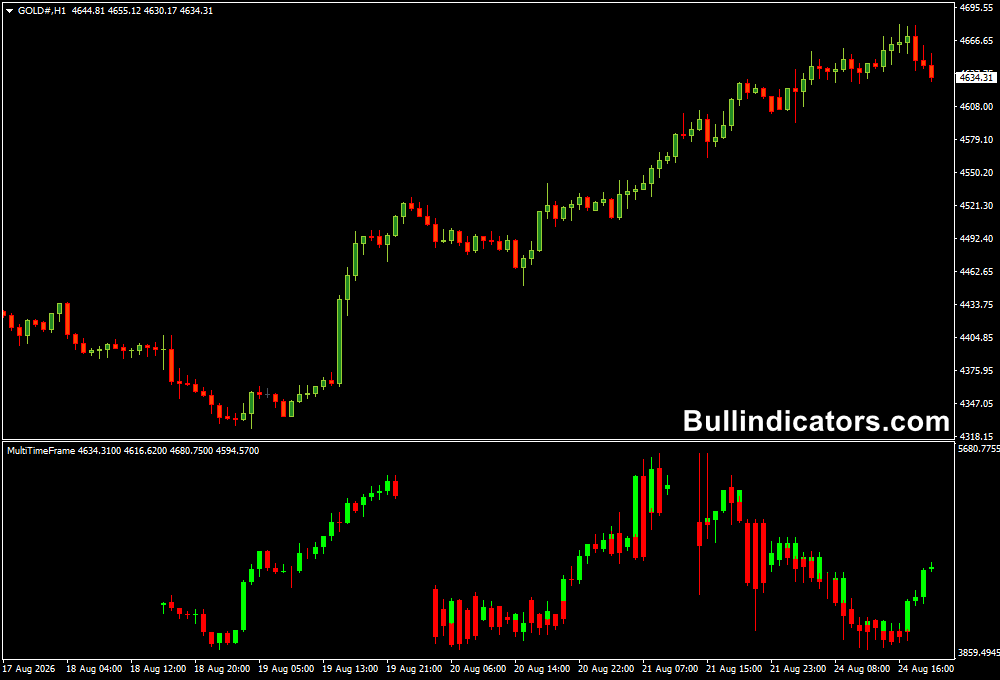
Once running on an MT4 chart, the tool displays three timeframe bars inside the indicator window.
Each section represents one selected period, with the highest timeframe shown first and the shortest timeframe shown last.
The default setup uses W1, D1, and H4.
For example, an upward weekly reading followed by bullish daily and H4 conditions suggests that buying pressure is developing across all three levels.
A disagreement between the periods can signal that the market is transitioning or that additional confirmation is needed.
Core Features
- Displays three timeframes on a single MT4 chart.
- Default configuration includes W1, D1, and H4.
- Allows each timeframe to be adjusted independently.
- Supports top-down market analysis.
- Helps compare long-term and short-term price direction.
- Useful for trend confirmation and entry timing.
Best for
- Identifying the dominant market direction.
- Confirming lower-timeframe setups with higher-timeframe conditions.
- Spotting potential changes in momentum.
- Planning entries and exits from a broader market perspective.
- Monitoring support and resistance areas across different periods.
Best Markets
- EUR/USD and GBP/USD for liquid intraday setups.
- GBP/JPY and EUR/JPY when stronger price movement is preferred.
- Gold (XAU/USD) for multi-timeframe momentum analysis.
- Major currency pairs during the London and New York sessions.
Trading Styles
- Scalping: M30, M5, and M1 combinations.
- Intraday trading: H4, H1, and M15 or D1, H4, and H1.
- Swing trading: W1, D1, and H4.
- Position trading: MN, W1, and D1.
How traders use it
A practical method is to begin with the highest timeframe and work downward.
The weekly view can define the main market bias, followed by the daily chart to evaluate whether that direction remains intact.
The H4 reading can then be used to determine whether shorter-term momentum supports a potential position.
For example, suppose EUR/USD is showing bullish conditions on W1, the latest daily candles continue to support upward momentum, and the H4 timeframe also turns bullish.
The alignment provides stronger confirmation for a long setup than relying on the H4 chart alone.
The same process works in reverse for short positions.
When the higher timeframe is bearish and the lower periods begin moving in the same direction, the combination can provide a framework for identifying potential selling opportunities.
Get Instant Free Access
Indicator Settings
- TF1: Selects the first and highest timeframe displayed.
- TF2: Selects the second timeframe used for intermediate analysis.
- TF3: Selects the third and lowest timeframe displayed.
- Colors: Controls the colors used for the displayed timeframe readings.
Important Notes
- Higher timeframes generally carry more weight when establishing the overall market bias.
- A lower-timeframe signal should be evaluated in relation to the larger trend.
- The default W1, D1, and H4 combination is suited to broader market analysis but can be changed to match your trading timeframe.
- Use the three readings as part of a complete trading plan rather than relying on one timeframe alone.
- Different timeframe combinations can produce different signals, so select periods that match your trading horizon.









