
The Bank Levels indicator for MT4 is a price action tool designed to display important psychological levels where major market participants may place orders.
Large financial institutions and professional market players often monitor specific price areas because these levels can influence market reactions.
These levels are commonly found around important highs, lows, rounded numbers, and areas where price has reacted multiple times.
The indicator automatically plots these zones on the MetaTrader 4 chart, helping traders identify possible support, resistance, and breakout locations.
The Bank Levels Indicator is especially useful for intraday traders and scalpers who analyze short-term price movements around key market areas.
Why traders use Bank Levels Indicator
Institutional order flow can have a significant impact on currency movements.
Many professional participants pay attention to psychological price levels because these areas often attract increased buying or selling activity.
The Bank Levels Indicator helps traders locate these important levels without manually searching through historical price data.
By displaying potential reaction zones directly on the chart, users can prepare trading scenarios before price reaches these areas.
These levels can be used in different ways. Some traders look for reversal opportunities when price rejects a bank level, while others wait for breakouts when price moves strongly through the level and confirms a new direction.
The indicator can also complement other technical approaches such as round number analysis, Fibonacci levels, and pivot point strategies to create a more complete trading plan.
Download This MT4 Indicator for Free
Indicator Chart Setup
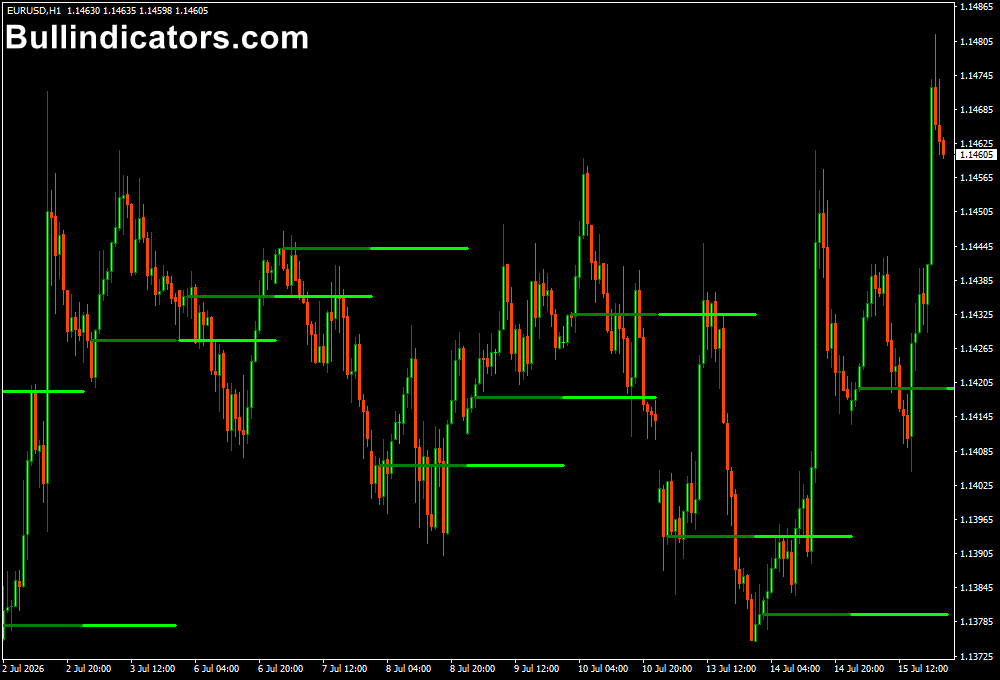
After applying the Bank Levels Indicator to a MetaTrader 4 chart, horizontal levels appear automatically based on the selected settings.
These lines represent important price areas that may act as support, resistance, or potential turning points.
The indicator separates current day levels and upcoming levels using different colors.
This allows traders to quickly identify which areas are currently relevant and which levels may become important during future sessions.
These levels can be displayed on various timeframes, although they are particularly useful on intraday charts such as M15, M30, and H1 where short-term reactions often occur.
Core Features
- Automatically plots important bank and psychological levels
- Displays current day and next day levels
- Highlights potential support and resistance areas
- Useful for reversal and breakout analysis
- Helps identify important intraday price zones
- Works with different trading strategies and timeframes
Best for
- Finding key intraday reaction levels
- Analyzing support and resistance zones
- Planning reversal setups around important prices
- Trading breakouts after strong level violations
- Combining institutional level analysis with price action
Best Markets
- Major forex pairs such as EUR/USD, GBP/USD, and USD/JPY
- JPY pairs where psychological levels often influence price action
- Gold (XAU/USD) due to strong reactions around key numbers
- Major indices such as NASDAQ and DAX
- Currency markets with high liquidity and active sessions
Trading Styles
- Scalping around short-term support and resistance levels
- Intraday trading using H1 and M30 price reactions
- Breakout trading after confirmation beyond key levels
- Reversal trading with candlestick confirmation
- Price action strategies based on institutional levels
How traders use it
A common method is waiting for price to approach one of the displayed bank levels and observing the market reaction.
If price reaches a level and begins to stall, traders often look for reversal signals such as Doji candles, Hammer patterns, Spinning Tops, or Pin Bars.
For example, when price drops into a bank level and forms a bullish rejection candle, some traders may consider a buy setup.
The stop loss is commonly positioned below the reaction area to protect against a failed reversal.
When price breaks strongly through a bank level, the approach changes from reversal trading to breakout analysis.
Forex traders wait for price to retest the broken level before entering, looking for confirmation that the previous resistance has become support or the previous support has become resistance.
The indicator works well with multiple timeframe analysis.
A higher timeframe can identify major levels, while a lower timeframe can provide more accurate entry timing.
Get Instant Free Access
Indicator Settings
- Start Hour: Defines the starting hour used for calculating displayed levels.
- Days Ago: Sets how many previous days of bank levels are shown.
- Color Current Day: Changes the color of current day levels.
- Color Next Day: Adjusts the color of upcoming day levels.
Important Notes
- Bank levels should be treated as areas of interest rather than guaranteed reversal points.
- Price can break through important levels during strong market momentum.
- Combining levels with candlestick confirmation can improve trade selection.
- Different markets may react differently to psychological price zones.
- Proper risk management remains essential when trading around key levels.









