
The Daily Open Line indicator for MT5 is a simple charting tool that helps identify the opening level of each trading day.
It draws a dotted horizontal line from the start of the trading day across the chart, giving you a clear reference for comparing current price action with the daily opening level.
The relationship between price and the daily open can provide useful directional context.
When price remains above the daily open, it can support a bullish market bias, while sustained movement below the level can point toward bearish pressure.
This makes the indicator particularly useful when analyzing H1, M30, M15 and M5 charts.
The previous day’s price movement can also be reviewed alongside the daily open to establish the broader directional context before looking for an intraday entry.
Why traders use the Daily Open Line Indicator
The daily open provides a fixed reference point for measuring how price is performing during the current trading day.
Having this level clearly marked makes it easier to see whether buyers or sellers are currently controlling the intraday movement.
Price holding above the daily open may support long setups, while repeated rejection below the level can provide bearish confirmation.
The line can also be used together with RSI, MACD, moving averages, support and resistance, or price action to filter potential entries.
For short-term trading, the daily open can serve as a directional filter.
Rather than treating every M5 or M15 signal equally, the current position of price relative to the daily open can help determine whether a setup agrees with the broader daily direction.
Download This MT5 Indicator for Free
Indicator Chart Setup
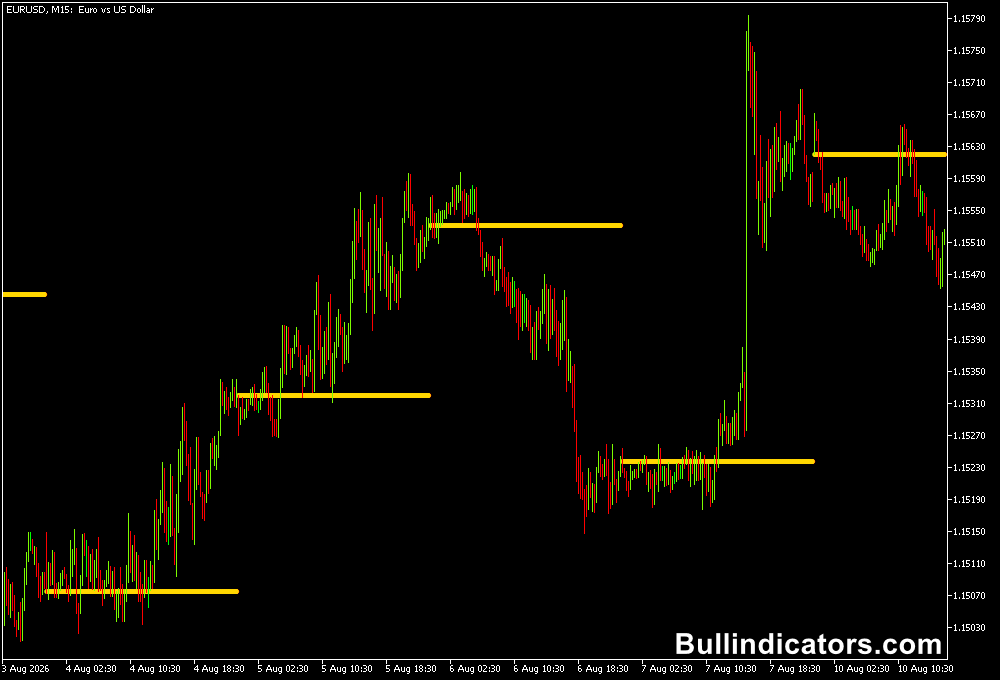
When applied to an H1 or lower timeframe chart, the indicator displays a dotted horizontal line representing the daily opening price.
The line provides a consistent reference throughout the trading day, allowing you to compare each new candle with the day’s starting level.
The indicator is particularly useful on M5, M15, M30 and H1 charts because these timeframes allow you to study short-term price action in relation to the daily open.
The Timeshift setting can also be adjusted when the broker’s server time differs from the timezone you want to use for the daily calculation.
Core Features
- Marks the daily opening price with a dotted horizontal line.
- Provides a clear reference for intraday market direction.
- Helps compare current price action with the start of the trading day.
- Useful for identifying bullish and bearish daily bias.
- Can be combined with price action and other technical indicators.
- Includes a Timeshift setting for adjusting the data timezone.
Best for
- Determining the current intraday direction.
- Filtering M5 and M15 entries according to the daily bias.
- Monitoring breakouts and rejections around the daily open.
- Confirming trend-following setups.
- Finding pullback opportunities that remain aligned with the daily direction.
Best Markets
- EURUSD for short-term setups around the daily open.
- GBPUSD during active London and US trading hours.
- USDJPY for directional intraday movements.
- EURJPY and GBPJPY when stronger volatility creates clear movement around the daily level.
- Other major forex pairs with good liquidity and relatively low spreads.
Trading Styles
- M5 scalping using the daily open as a directional filter.
- M15 intraday trading with price-action confirmation around the level.
- M30 trend trading based on sustained movement above or below the daily open.
- H1 pullback and continuation setups aligned with the current daily bias.
How traders use it
The daily open can act as a simple dividing line between bullish and bearish intraday conditions.
When price remains above the level and continues producing higher highs and higher lows, the bullish bias is strengthened.
When price stays below the line and forms lower highs and lower lows, bearish pressure becomes more evident.
For short-term entries, the most useful approach is to combine the daily open with price action.
A break through the level, a retest, or a rejection can provide a setup when supported by the surrounding market structure.
EURUSD M15 Buy Example
- EURUSD opens the day and establishes itself above the daily open.
- Price continues higher and forms a sequence of higher lows on the M15 chart.
- A pullback returns toward the daily open or a nearby support area while price remains above the line.
- A bullish rejection candle confirms a possible buy entry.
- The recent swing low can be used as a stop loss reference, while a previous high or resistance area can provide a potential target.
EURUSD M15 Sell Example
- EURUSD trades below the daily open and begins forming lower highs on the M15 chart.
- Price rallies back toward the daily open but fails to establish itself above the line.
- A bearish rejection candle or lower-high formation appears near the level.
- A sell entry can be considered after bearish confirmation.
- The recent swing high can provide a stop loss reference, while a previous low or support zone can serve as a potential target.
Get Instant Free Access
Indicator Settings
- Timeshift: The default value is 0. This setting determines the timezone used for the daily data and can be adjusted to match the desired market or broker server time.
- Color: Controls the appearance of the dotted daily-open line.
Important Notes
- The indicator is intended for use on H1 and lower timeframes, with M5, M15 and M30 being particularly useful for intraday analysis.
- The daily open should be treated as a reference level rather than an automatic buy or sell signal.
- Use price action, market structure or other technical indicators to confirm entries.
- Check the Timeshift setting if the daily opening line does not correspond with the intended trading day.
- Low-liquidity periods can produce less reliable short-term reactions around the daily open.









