
The Murrey Math indicator for MT5 is a support and resistance tool designed to divide the current price range into multiple mathematical levels.
It automatically plots key price zones that can help identify potential reversals, breakouts, entries, stop loss locations, and profit targets.
The display also includes a central pivot level and upper and lower boundaries, giving a clear view of where price is positioned within its current range.
You can download the Murrey Math indicator for MT4 here.
Why traders use the Murrey Math Indicator
Murrey Math levels give a structured way to study price movement without relying on several separate indicators.
The central pivot helps define the current directional bias, while the surrounding levels highlight areas where price may pause, reverse, or continue through the range.
The levels can also be useful for planning trades before entering the market.
Support and resistance zones provide reference points for stop placement and potential targets, while the distance between levels helps assess whether a setup has enough room to develop.
Download This MT5 Indicator for Free
Indicator Chart Setup
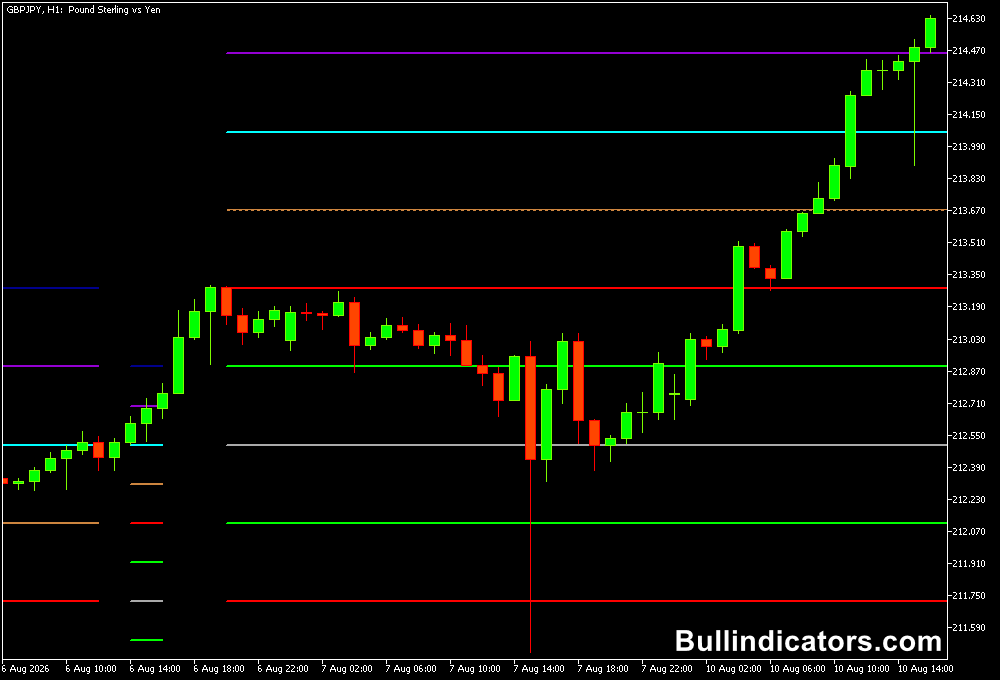
When applied to an MT5 chart, the Murrey Math Indicator displays a series of horizontal levels across the active price range.
The central Pivot Entry Point is shown in white.
Aqua marks the maximum resistance and marginal support areas, while purple and blue identify higher resistance levels.
Red marks the major reversal support and resistance zones, with yellow representing weaker stop and reversal levels.
Green lines define the upper and lower boundaries of the trading range.
The central level can be used as a directional reference.
Price holding above it can support a bullish interpretation, while sustained movement below it can indicate bearish pressure.
The outer levels are particularly useful when looking for potential exhaustion or reversal areas.
Core Features
- Automatically calculates Murrey Math support and resistance levels.
- Displays a central Pivot Entry Point for directional analysis.
- Marks major and weaker reversal zones.
- Shows the upper and lower boundaries of the trading range.
- Useful for entries, stop loss planning, and profit targets.
- Can be adjusted for different chart timeframes.
Best for
- Identifying potential reversal zones at major support and resistance.
- Confirming directional bias around the central pivot.
- Planning breakout and continuation trades.
- Setting logical stop loss and take profit reference points.
- Short-term scalping when combined with price-action confirmation.
Best Markets
- EURUSD and GBPUSD for liquid intraday setups.
- GBPJPY and CADJPY for wider price swings and clearly separated levels.
- Gold and major indices where support and resistance can play an important role.
- Major currency pairs during active London and New York sessions.
Trading Styles
- M1 and M5 scalping around the central pivot and nearby reversal levels.
- M15 and H1 intraday trading using level-to-level targets.
- H4 swing setups focused on major support and resistance zones.
- Daily and higher-timeframe analysis for broader market structure.
How traders use it
A simple approach is to monitor how price behaves around the central pivot.
A move above the pivot followed by bullish price action can provide a potential buy setup, with the next resistance level used as a reference for the target.
A stop can be positioned below the previous support level.
For a sell setup, price remaining below the pivot can indicate bearish pressure.
A bearish confirmation near the pivot may be used for an entry, with the next support level providing a potential target and a stop placed above nearby resistance.
Scalping example
For scalping, the same concept can be applied on M1 or M5.
For example, suppose GBPJPY is trading below the central pivot on M5 and then rallies toward the pivot without breaking above it.
If a bearish rejection candle forms at that level, a short setup could be considered.
A stop may be placed above the rejection area, while the next Murrey support level provides a reference for taking profit.
Price action should confirm the setup rather than relying on the line alone.
Get Instant Free Access
Indicator Settings
- P calculation period: The calculation period is based on multiples of 8. Higher values produce fewer, wider-spaced levels, while lower values create more levels. Higher values are generally more suitable for higher-timeframe charts.
- StepBack: Checks previous closing prices to provide confirmation for the calculated indicator levels.
- Colors Extra: Controls the additional visual color settings used for the displayed Murrey Math levels.
Important Notes
- Use an appropriate P calculation period for the selected timeframe.
- Allow for different settings when moving between intraday and higher-timeframe charts.
- Murrey Math levels identify important price areas but do not guarantee a reversal or continuation.
- Combine the levels with price action, market structure, and suitable risk management.
- During scalping, wait for confirmation around the level rather than entering solely because price touches it.









